How to access and analyze your Website Health Report
The Website Health Report provides visibility into how your Dealer Inspire website is performing across key technical and user experience metrics. By understanding this data, you can work with your Performance Manager and/or agency partners to make improvements that directly impact shopper engagement and lead conversion.
In this article, you’ll learn how to access your Website Health Report, interpret key metrics like Core Web Vitals, and identify third-party scripts that may be slowing down your site.
To get started
Go to the Cars.com Hub, click Reporting then Prizm
1 Accessing the report
To access the Website Health Report:
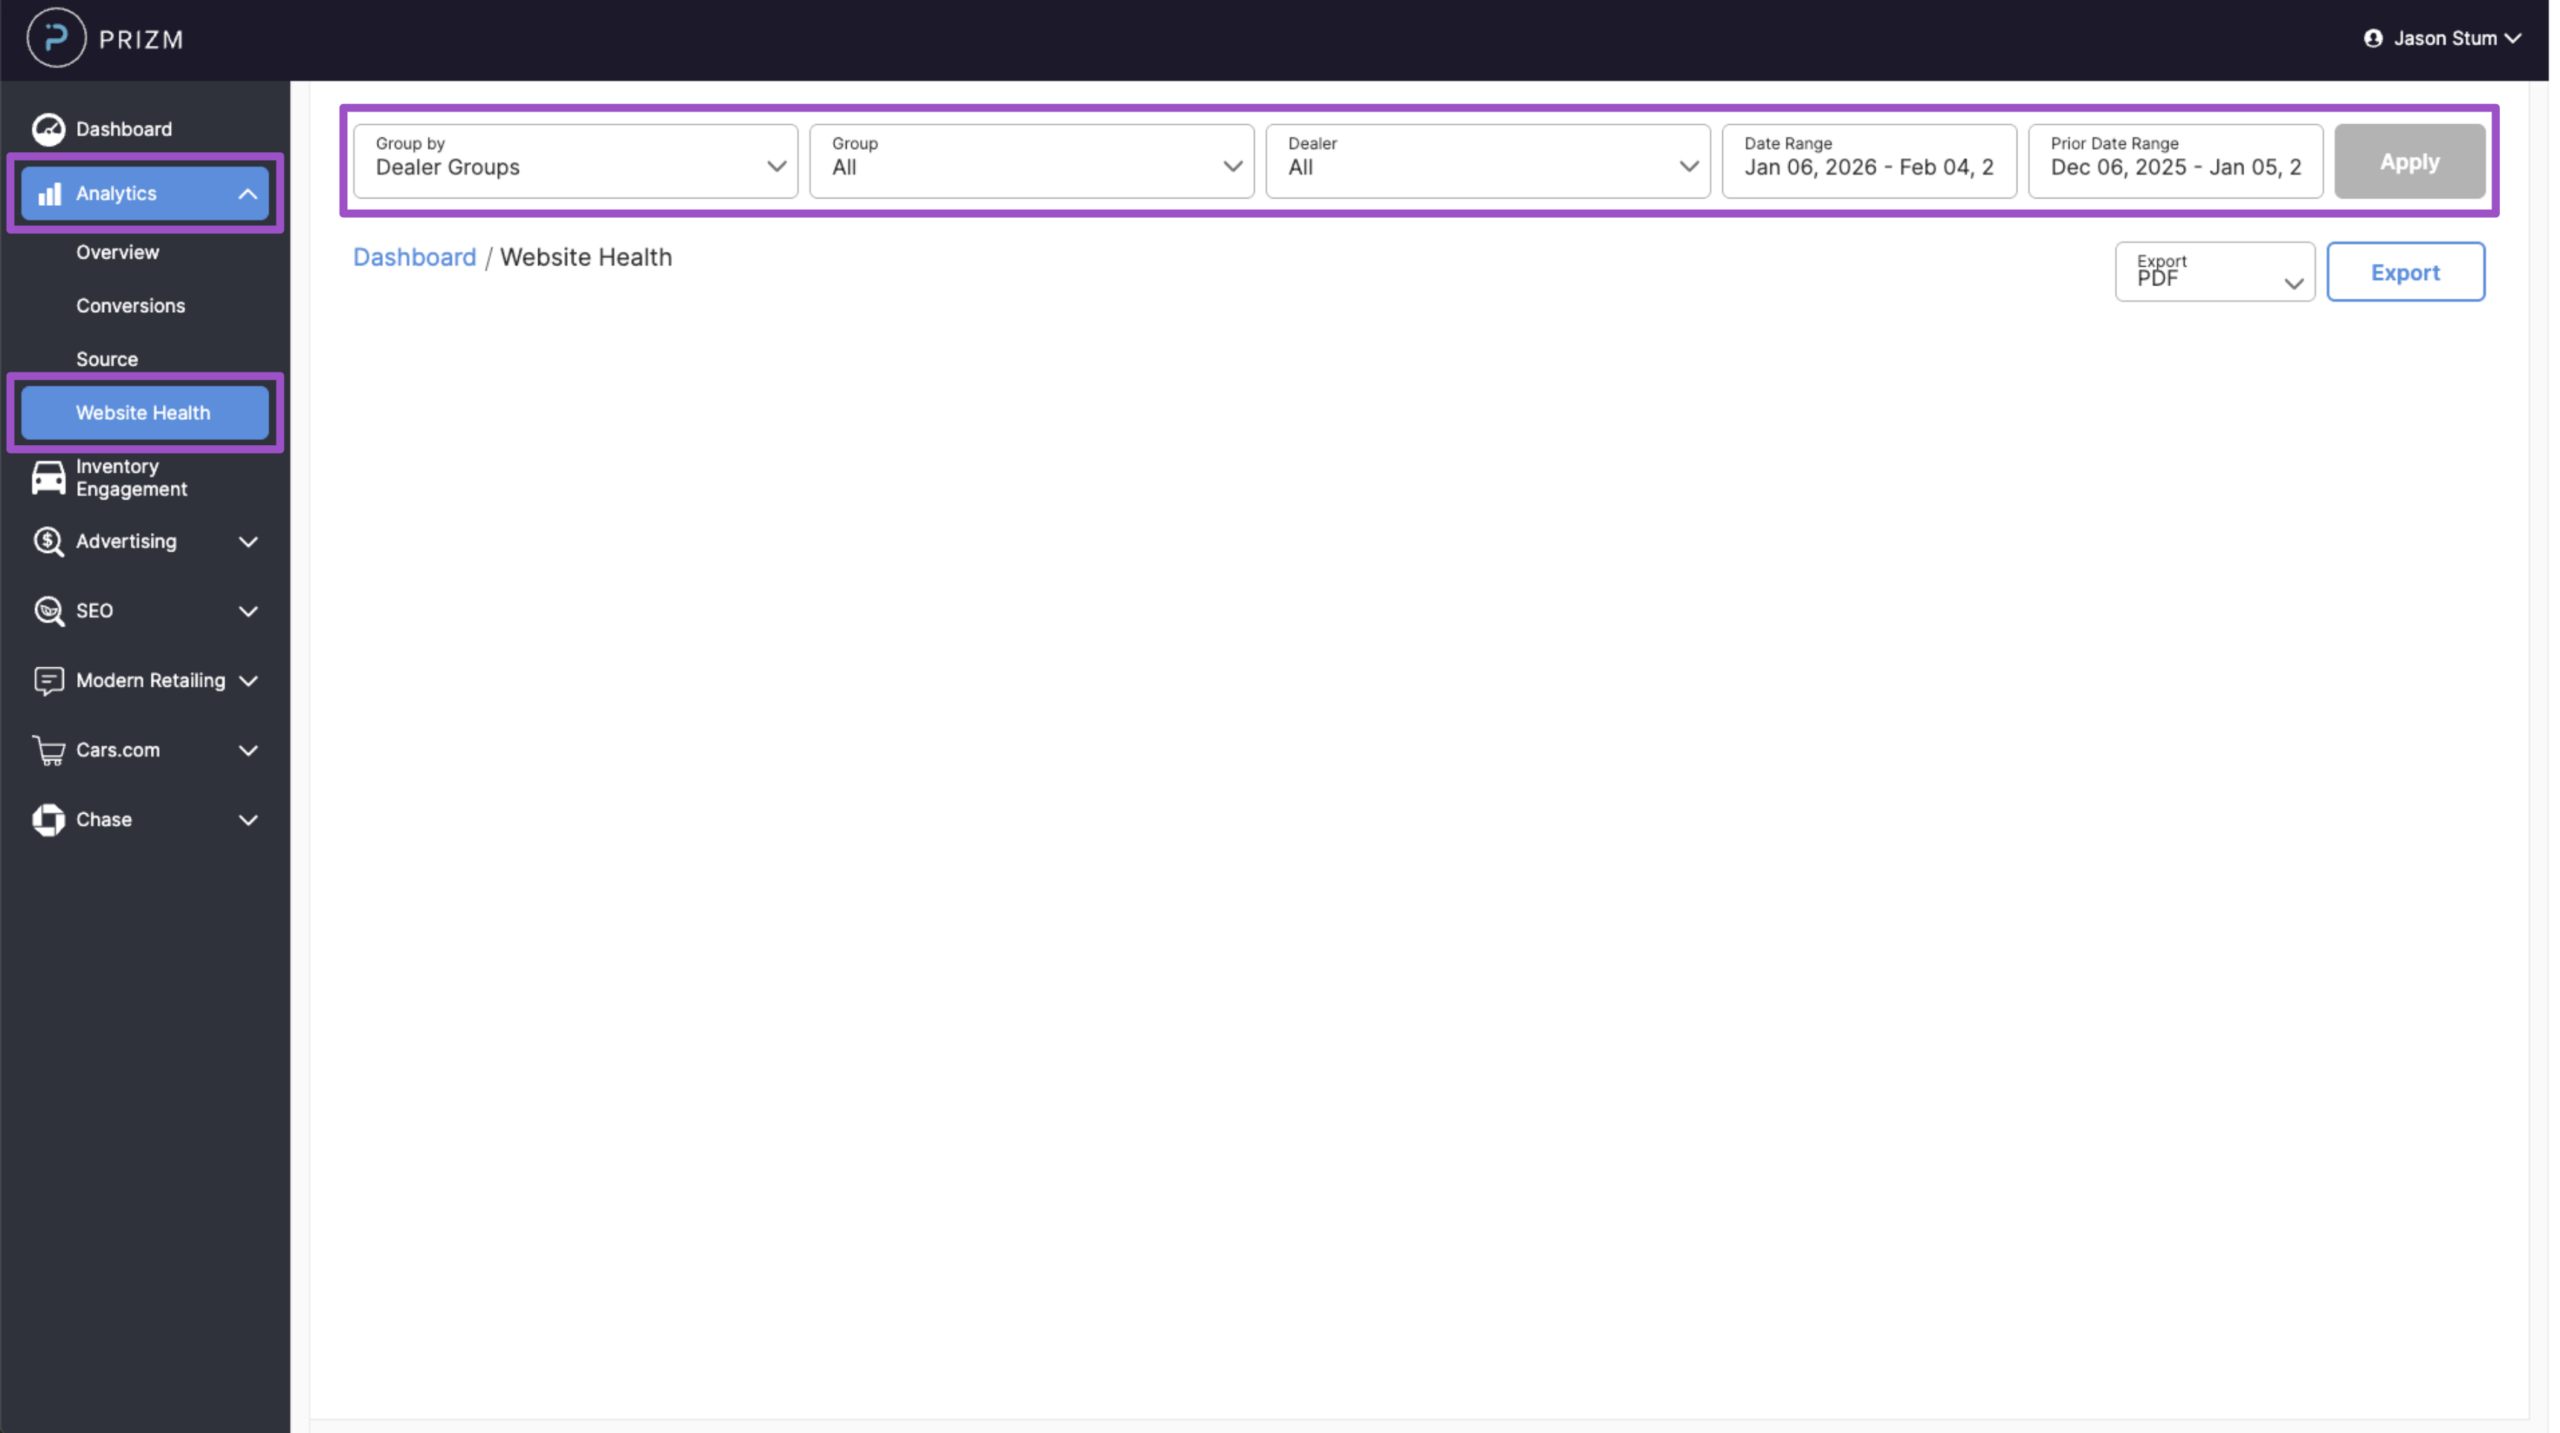
- Click Analytics in the left-hand navigation.
- Select Website Health Report.
- Use the filters to choose your dealership group, OEM, or date range.
- Click Apply to load the report.
2 Google Core Web Vitals
Core Web Vitals measure how real visitors experience your website, using data collected over a 28-day rolling window. These metrics help identify performance issues that affect load speed, interactivity, and visual stability — all of which impact shopper experience and search rankings.
You’ll see color-coded scores for the following metrics:
- Largest Contentful Paint (LCP): Measures loading speed — how long it takes the main content to appear on the screen.
- Interaction to Next Paint (INP): Replaces First Input Delay (FID) — tracks how quickly your site responds to user interactions like clicks and taps.
- Cumulative Layout Shift (CLS): Measures visual stability — how much the layout shifts while the page is loading.
- First Contentful Paint (FCP): Tracks when the first piece of visible content appears, giving a sense of initial load speed.
- Time to First Byte (TTFB): Measures how quickly the browser receives the first byte of data from your server — a key indicator of server responsiveness.
Note: Mobile is the default view. Click the Desktop tab to ensure your site is optimized for all users, regardless of device.
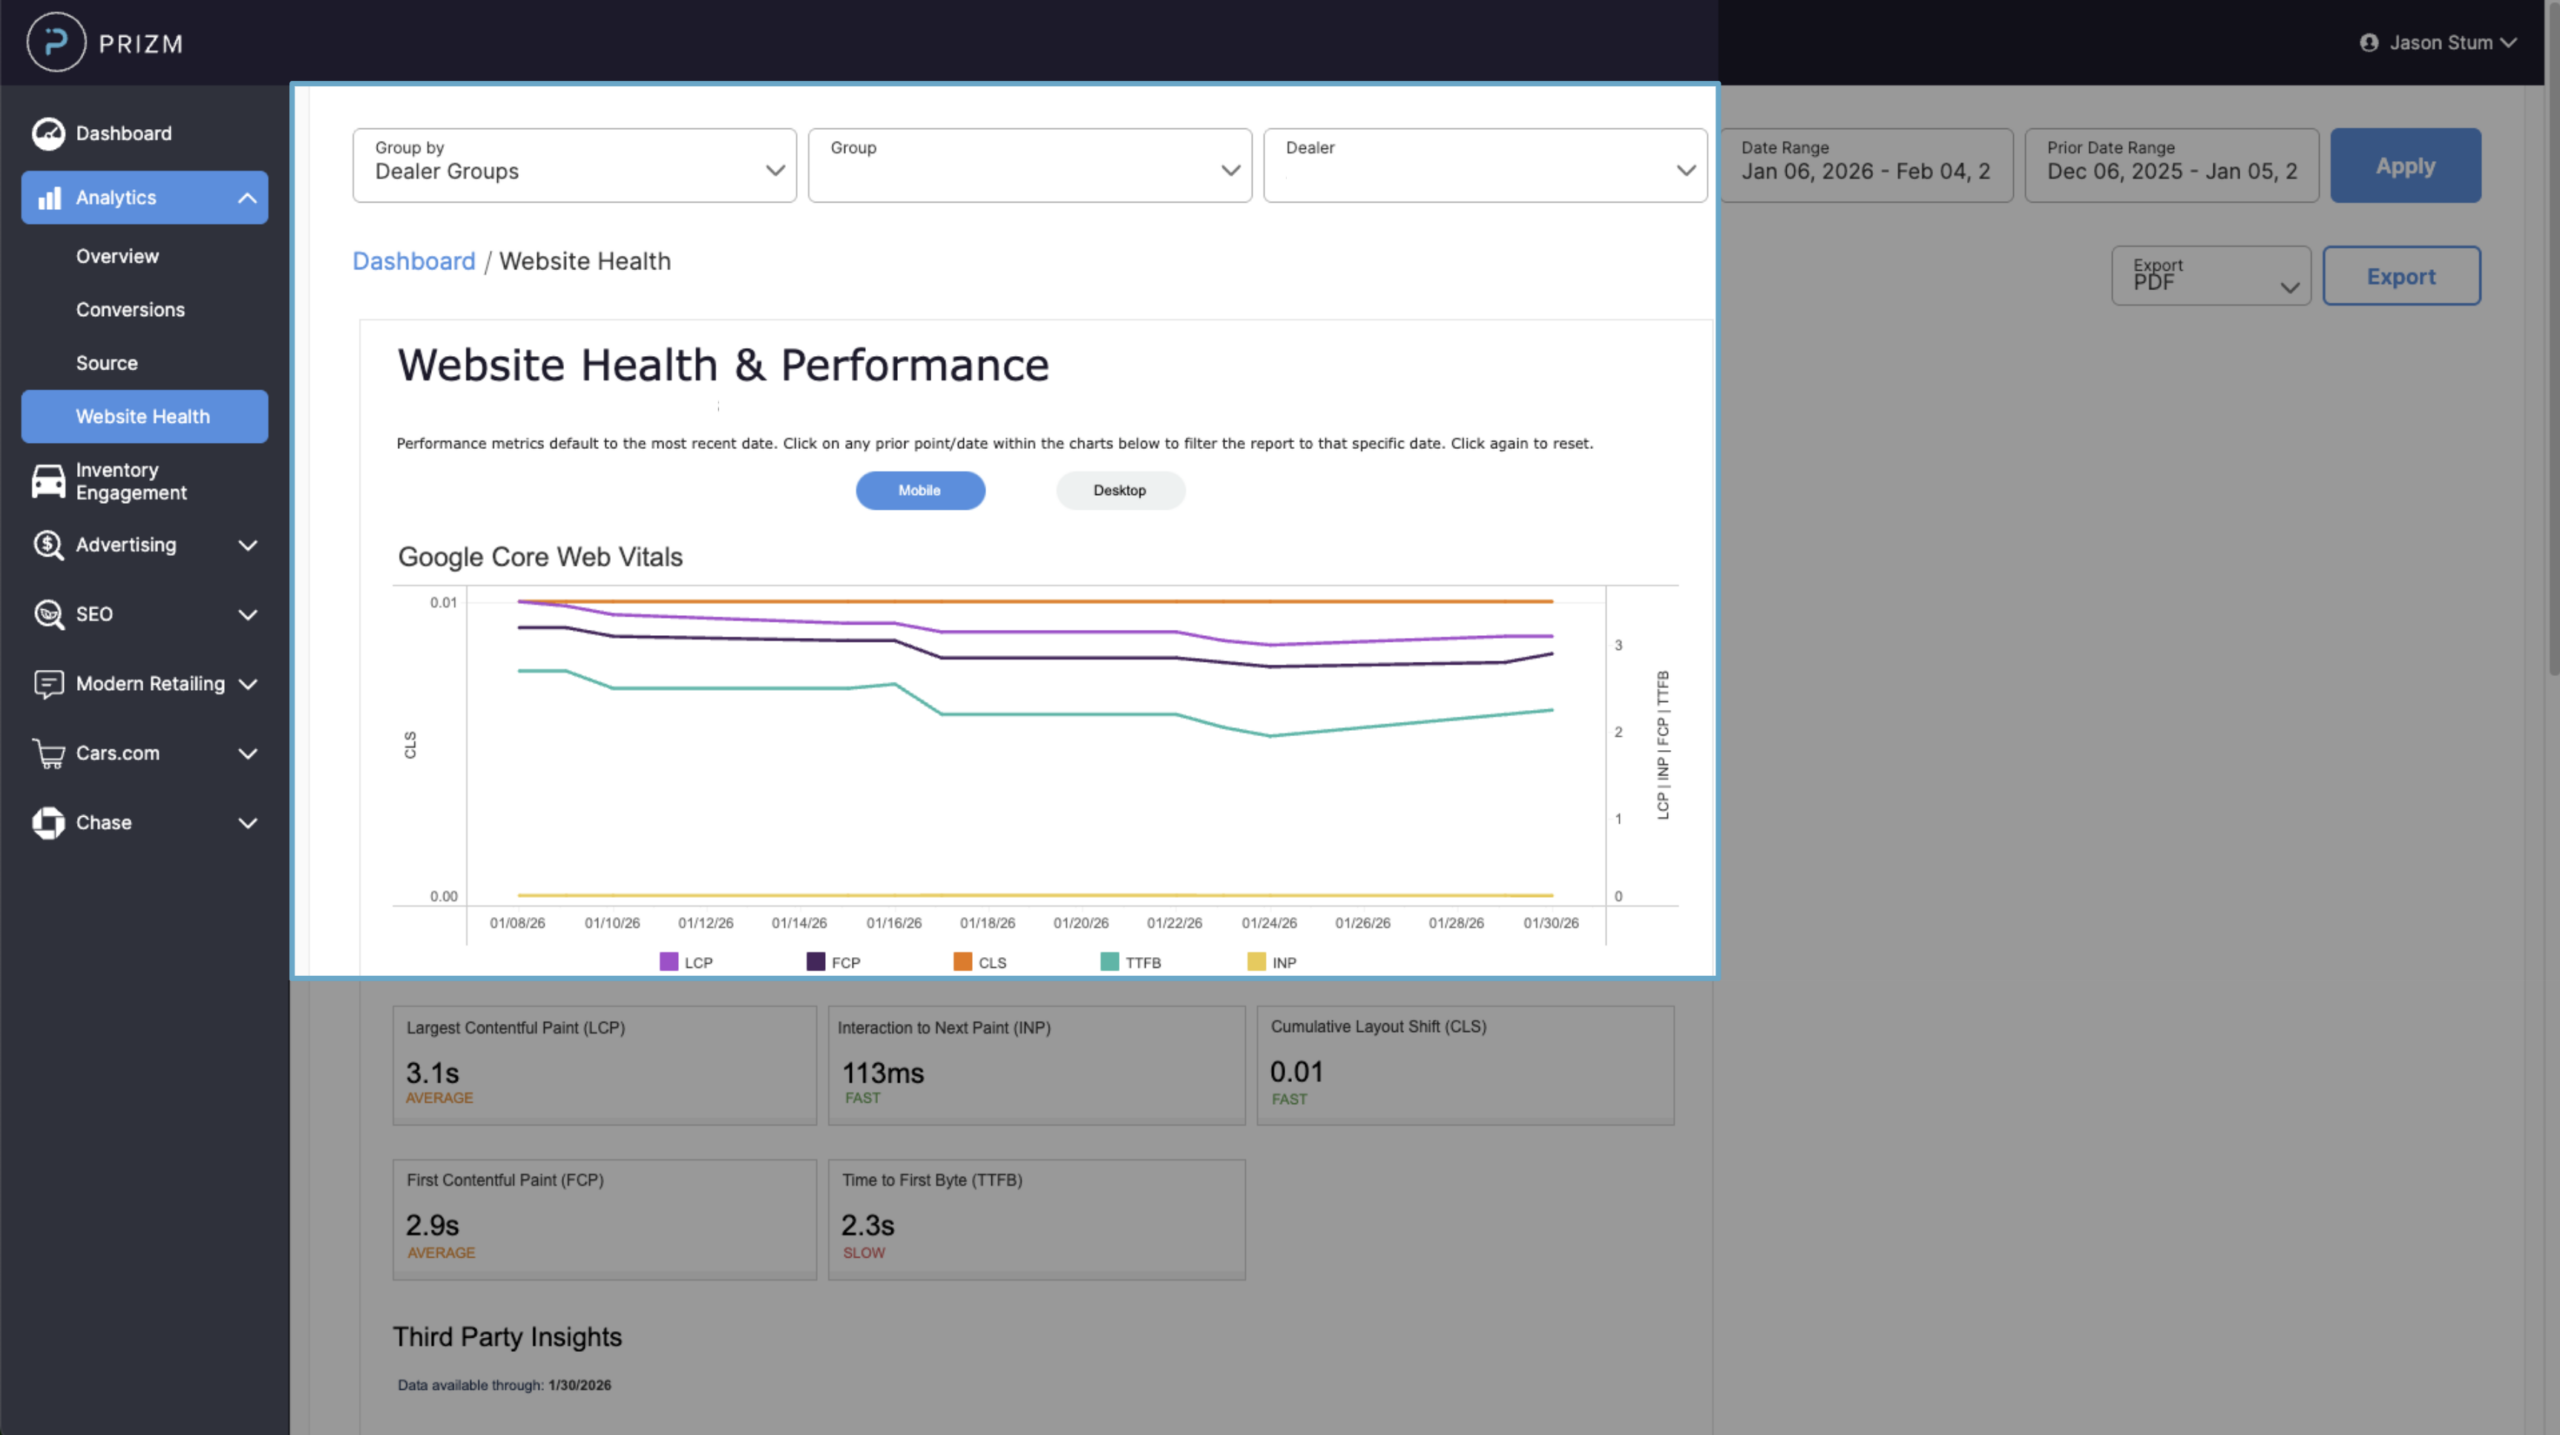
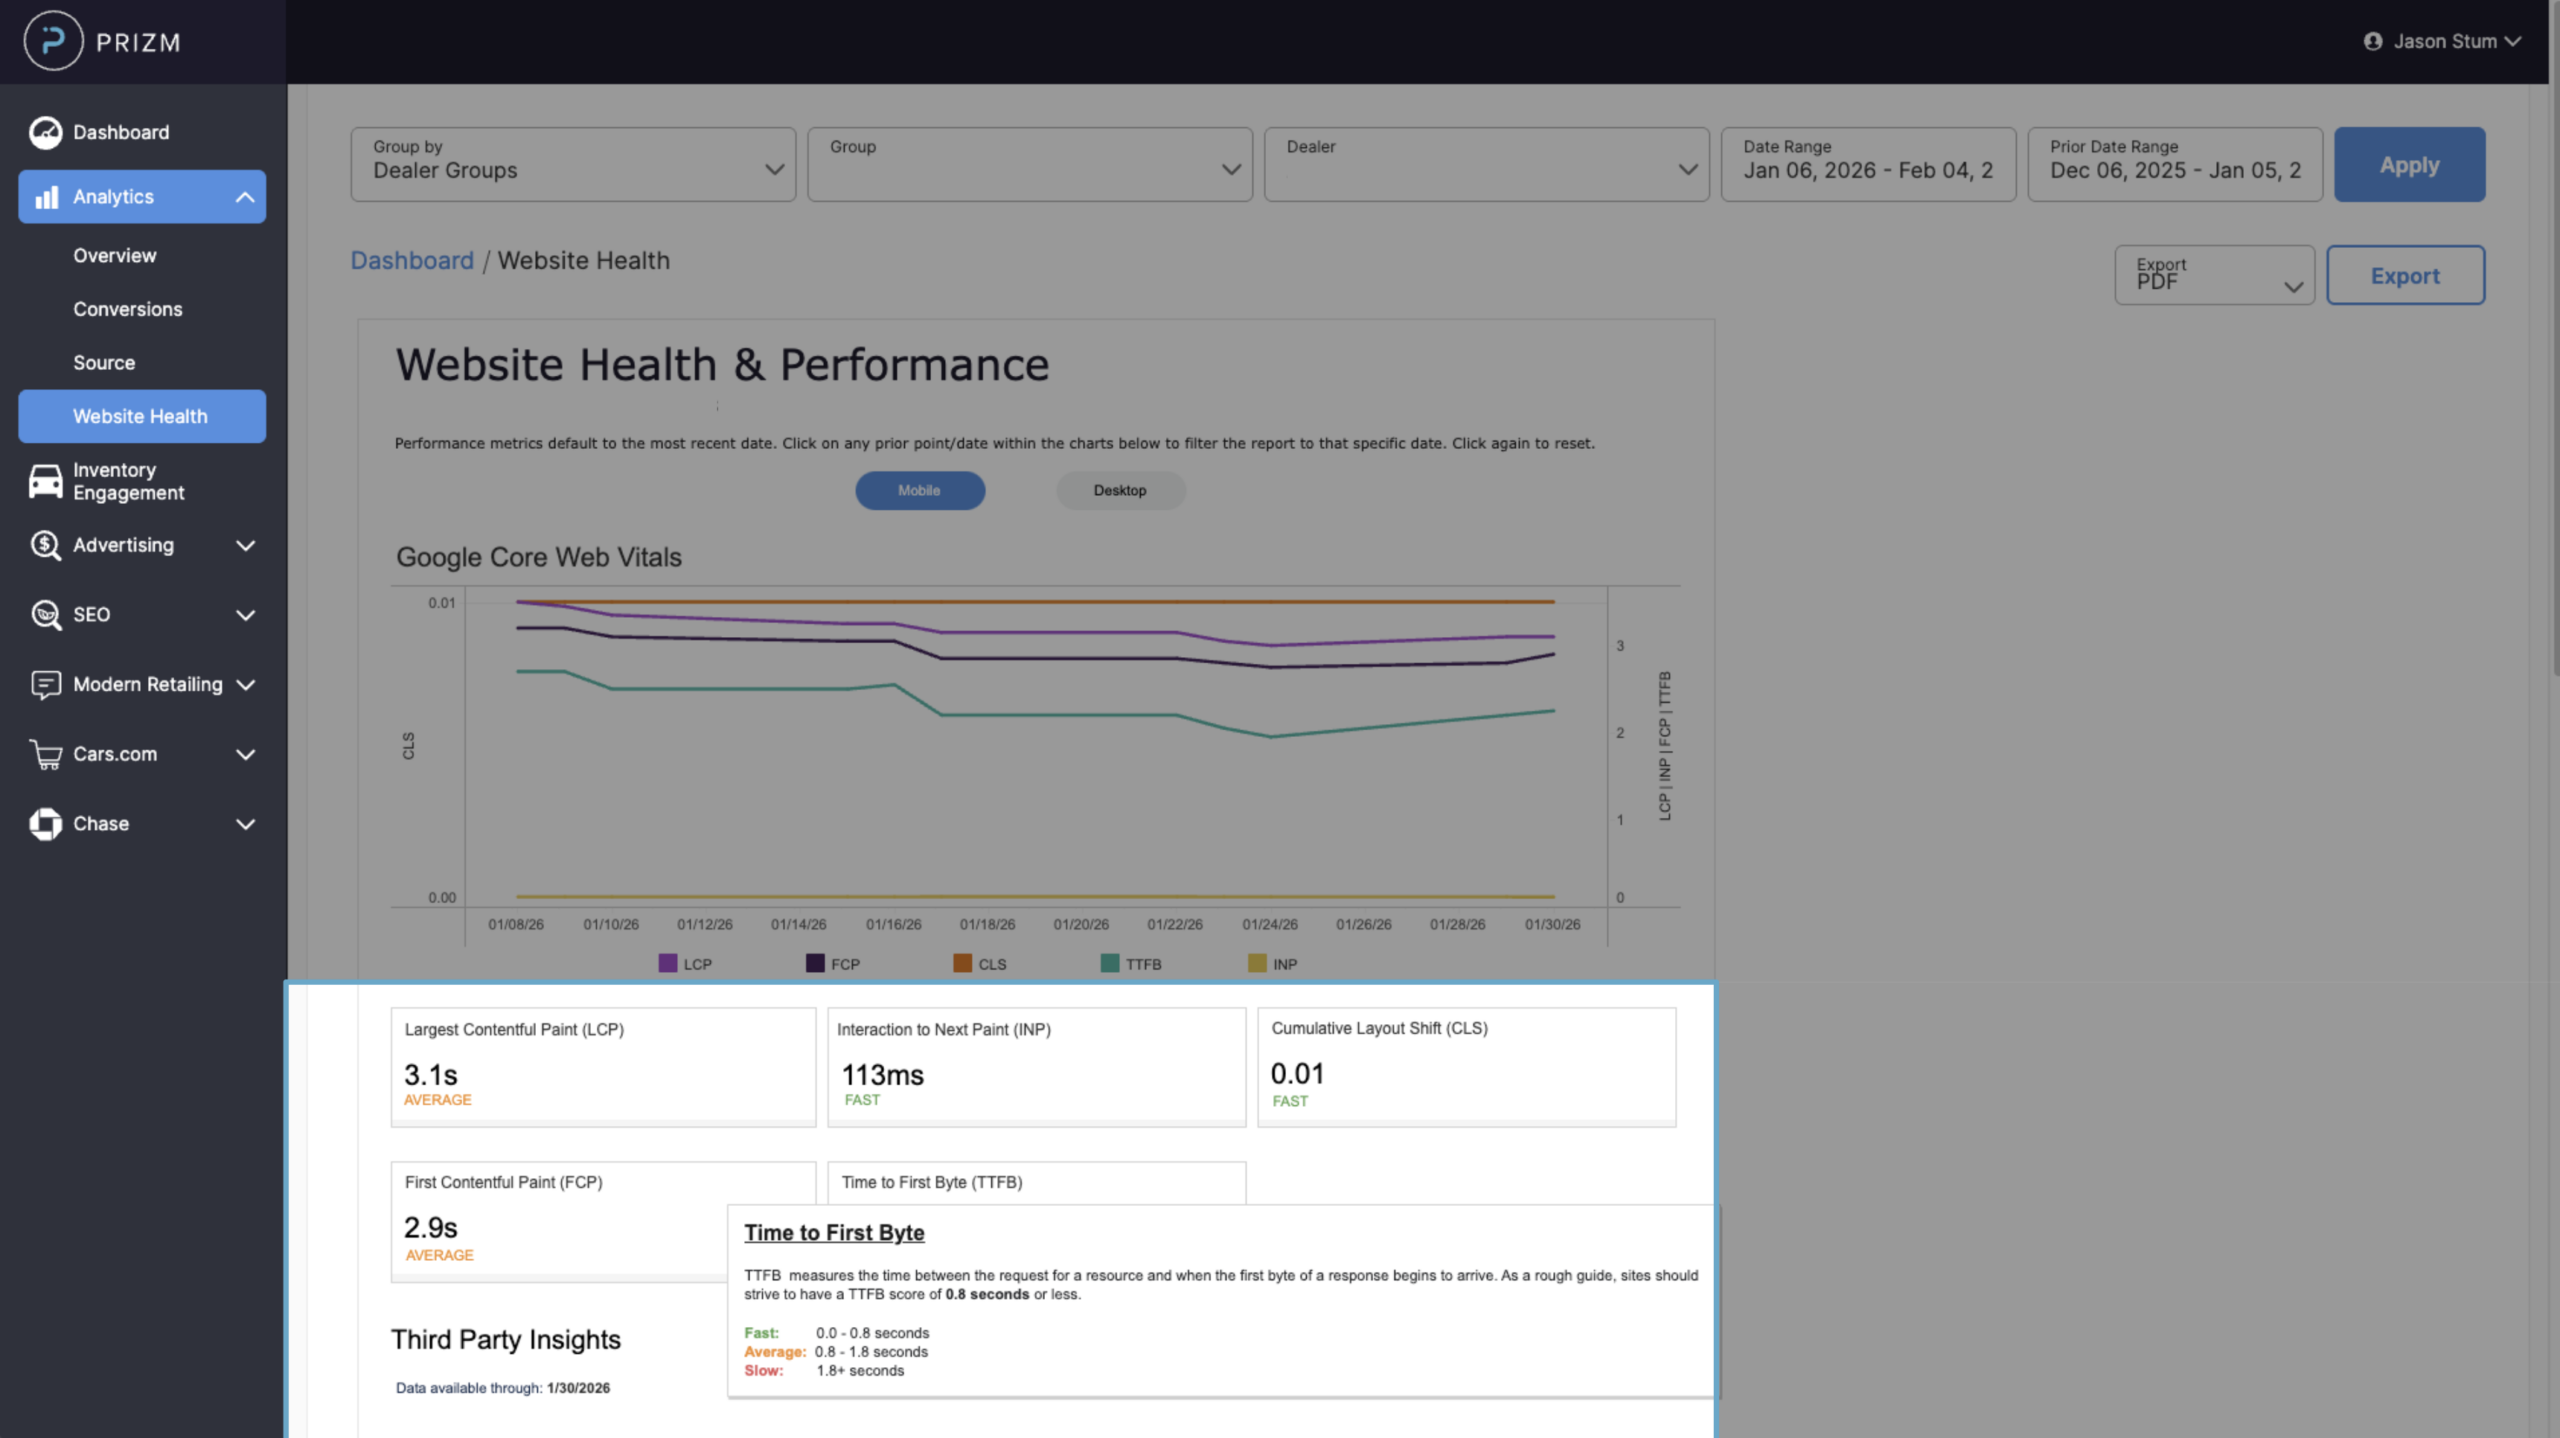
Hover over each score to view a definition, your site’s rating (Fast, Average, or Slow), and specific recommendations for improvement. These scores help guide technical and content updates that enhance both UX and search visibility.
3 Third Party Insights
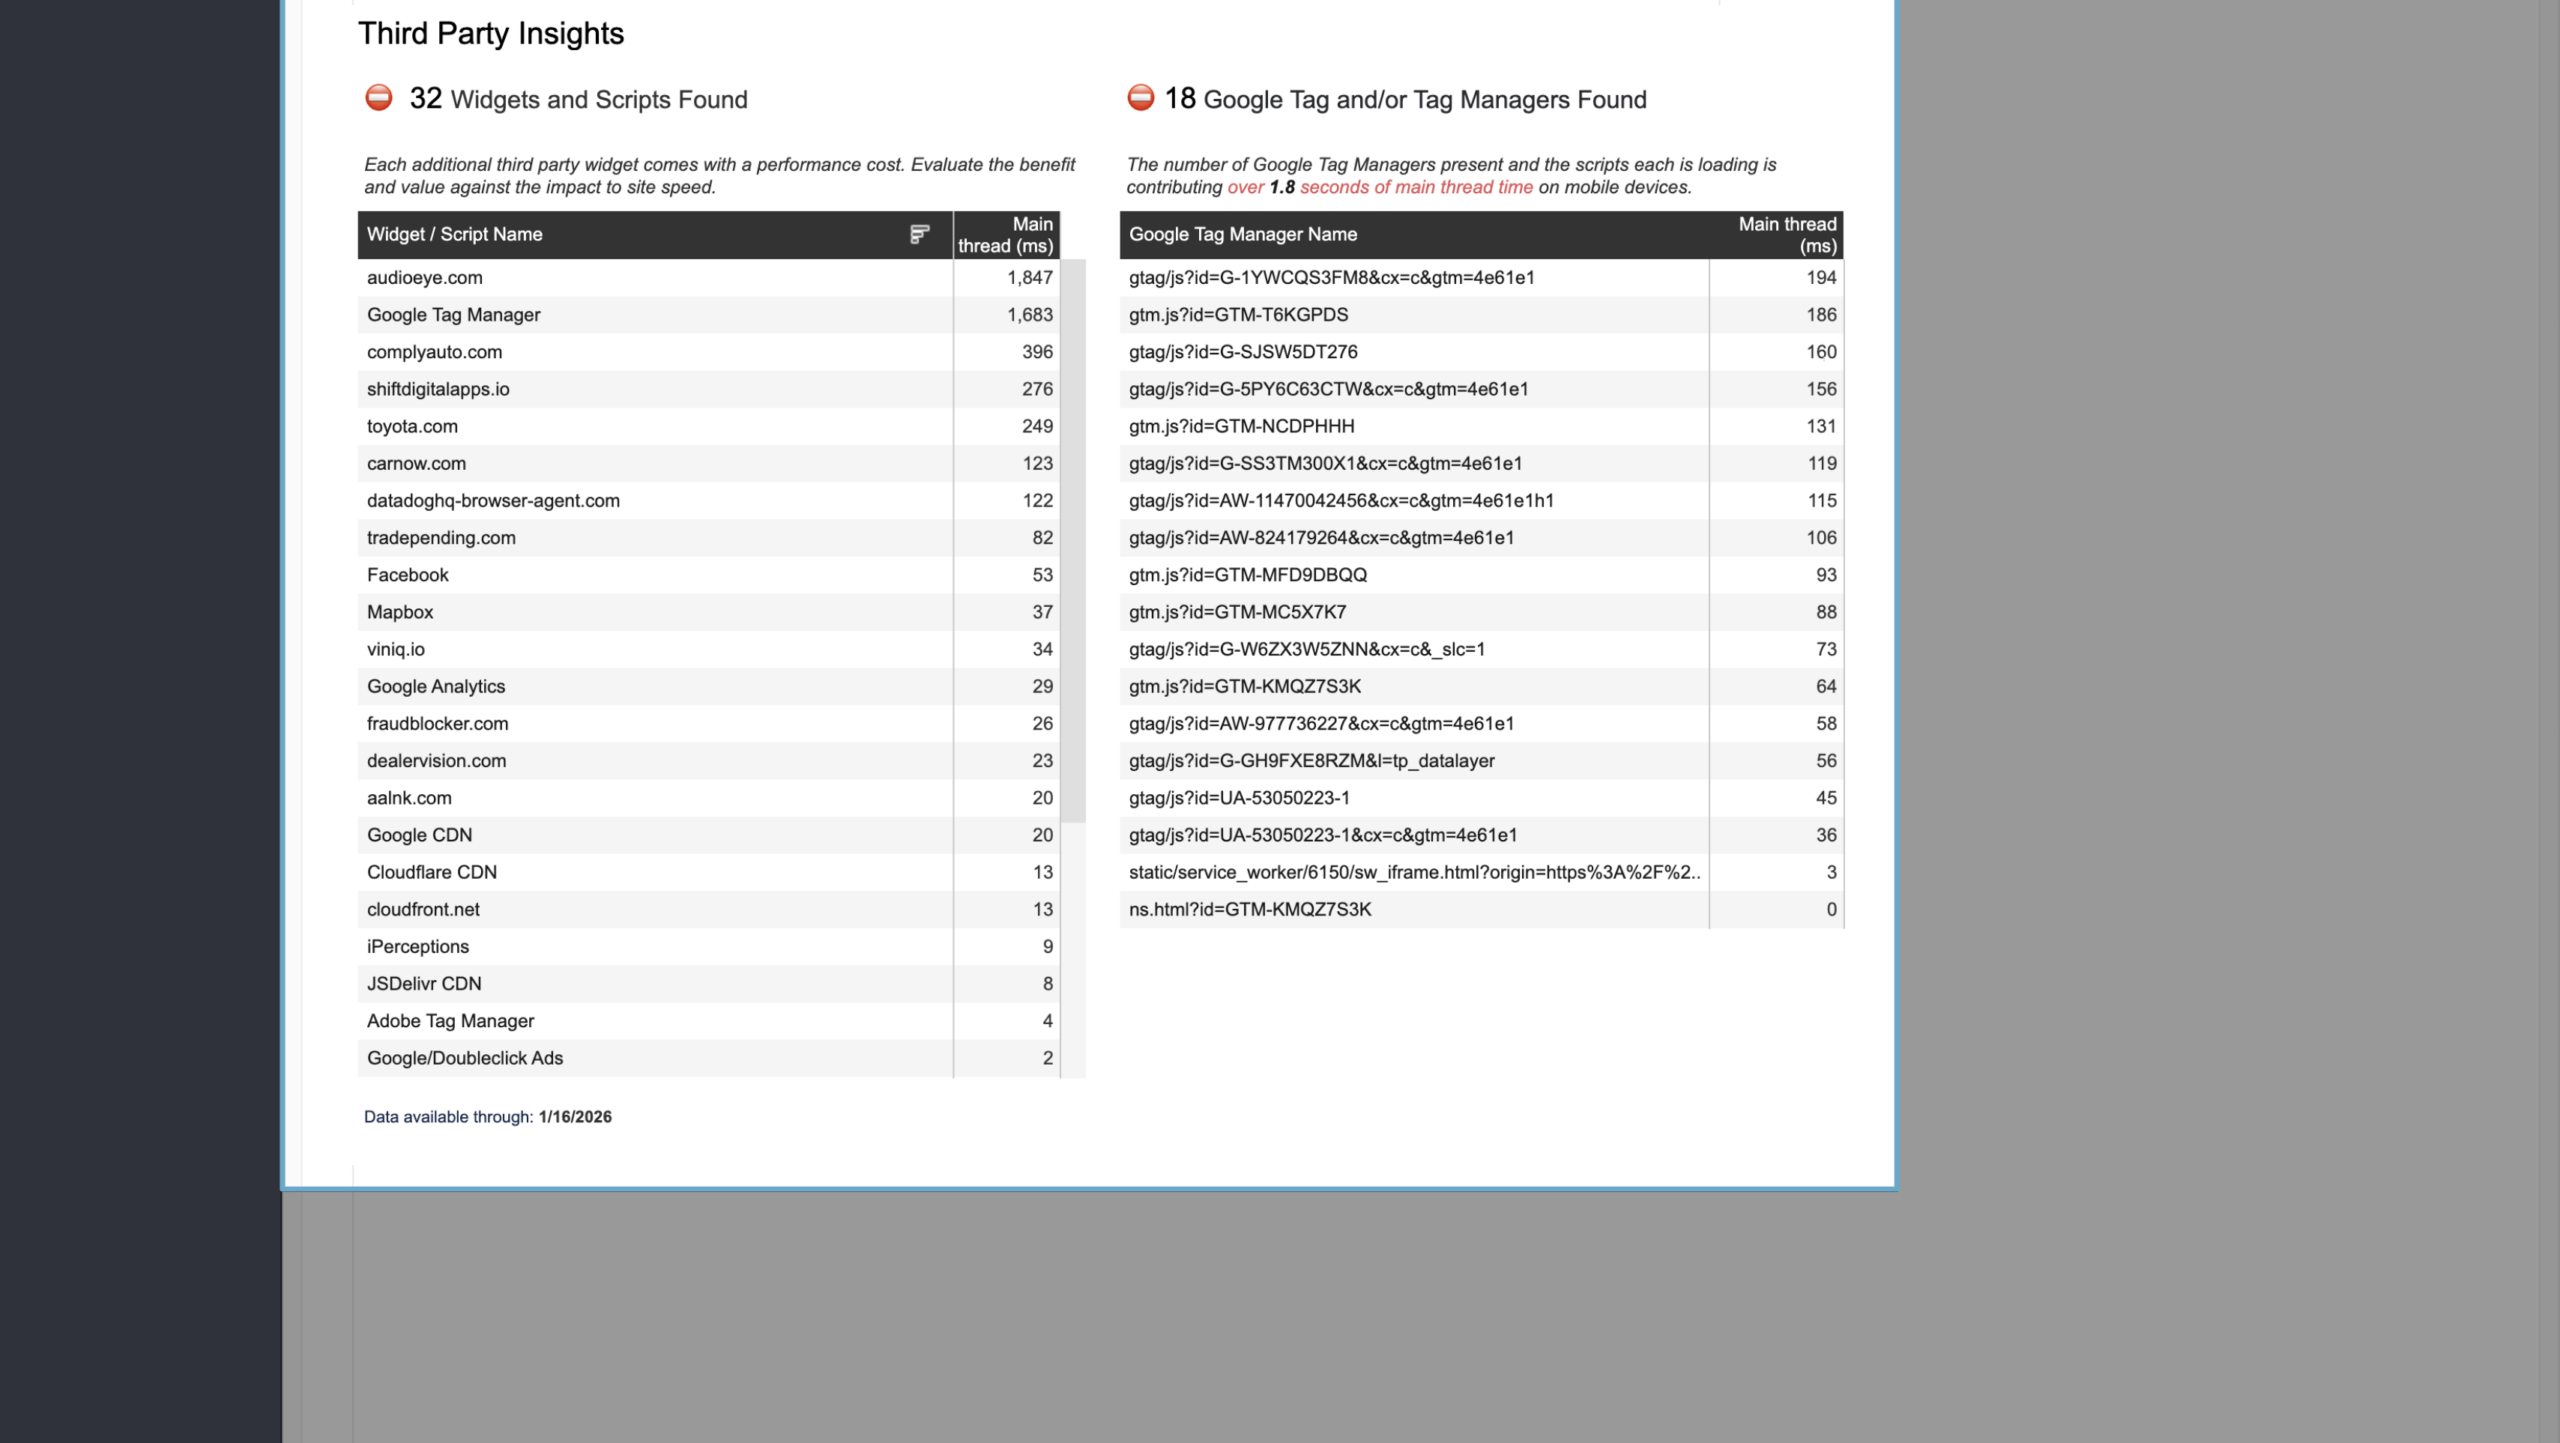
This section identifies third-party widgets and tools — such as chat plug-ins, trackers, or marketing scripts — that may impact site speed.
Tip: If your site uses more than 20 scripts via Google Tag Manager, it could be slowing performance. Audit and remove any unused or redundant tags to improve load time and site efficiency.