How to utilize the Intelligence Score
The Intelligence Score is a key feature in AccuTrade used for effective, risk-based inventory management. This score predicts how quickly a vehicle will sell based on three criteria: Vehicle Fit, Market Fit, and Dealer Fit.
In this article, you’ll learn how to locate the Vehicle Analysis section for any unit in your inventory, understand what each factor means, and learn the immediate actions you can take to manage vehicles in every risk scenario.
Note: To view a full overview of your inventory’s performance, use the Inventory Intelligence Report on your dashboard. This article focuses on viewing the score for a single vehicle.
To get started
Go to the Cars.com Hub, and click on AccuTrade.
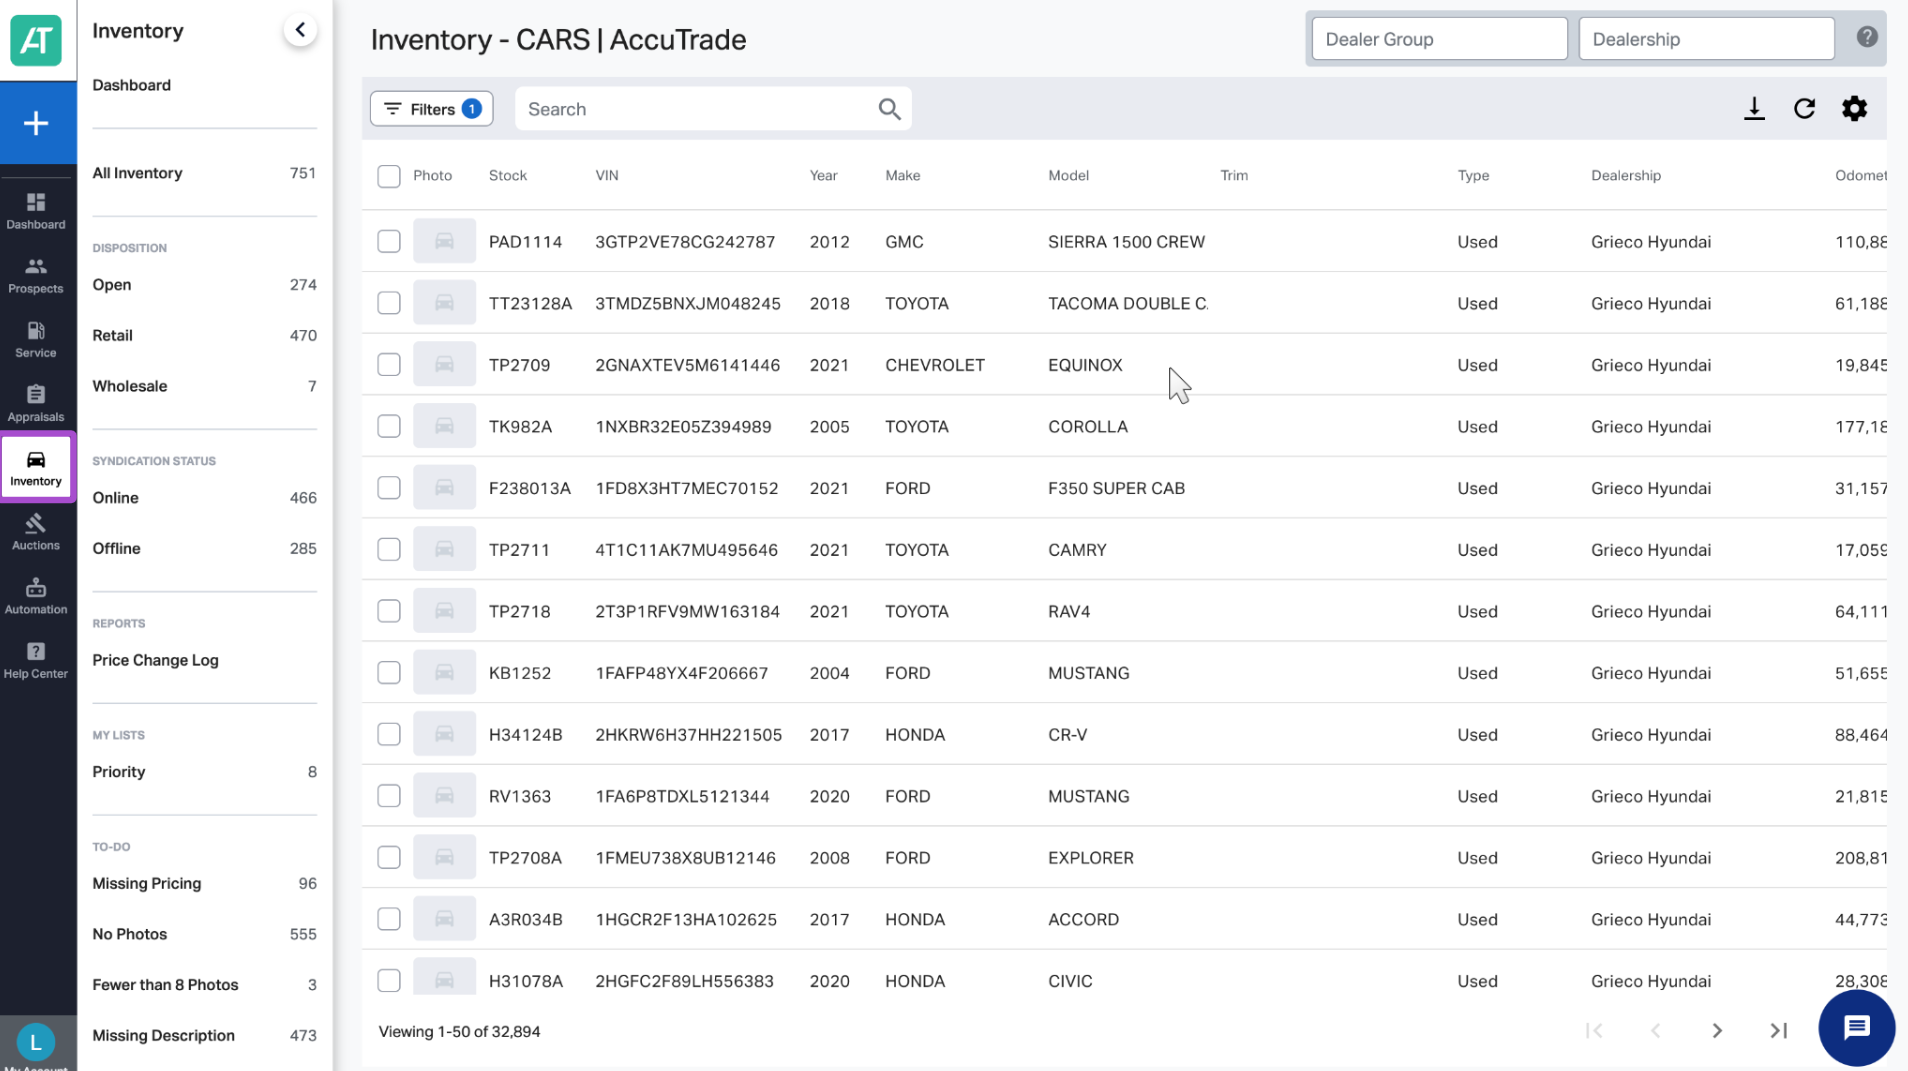
1 Select a vehicle from your inventory
From your AccuTrade dashboard, click the Inventory tab on the left menu.
Find the vehicle you’d like to analyze by searching, filtering, or scrolling through your list. Then, click into the row to view the vehicle.
2 Go to the Vehicle Analysis section
- Click the Market Pricing tab within the vehicle view.
- Scroll down to the Vehicle Analysis section.
- Locate the Intelligence Score — this section provides a breakdown of risk based on real-time market and dealership performance data.


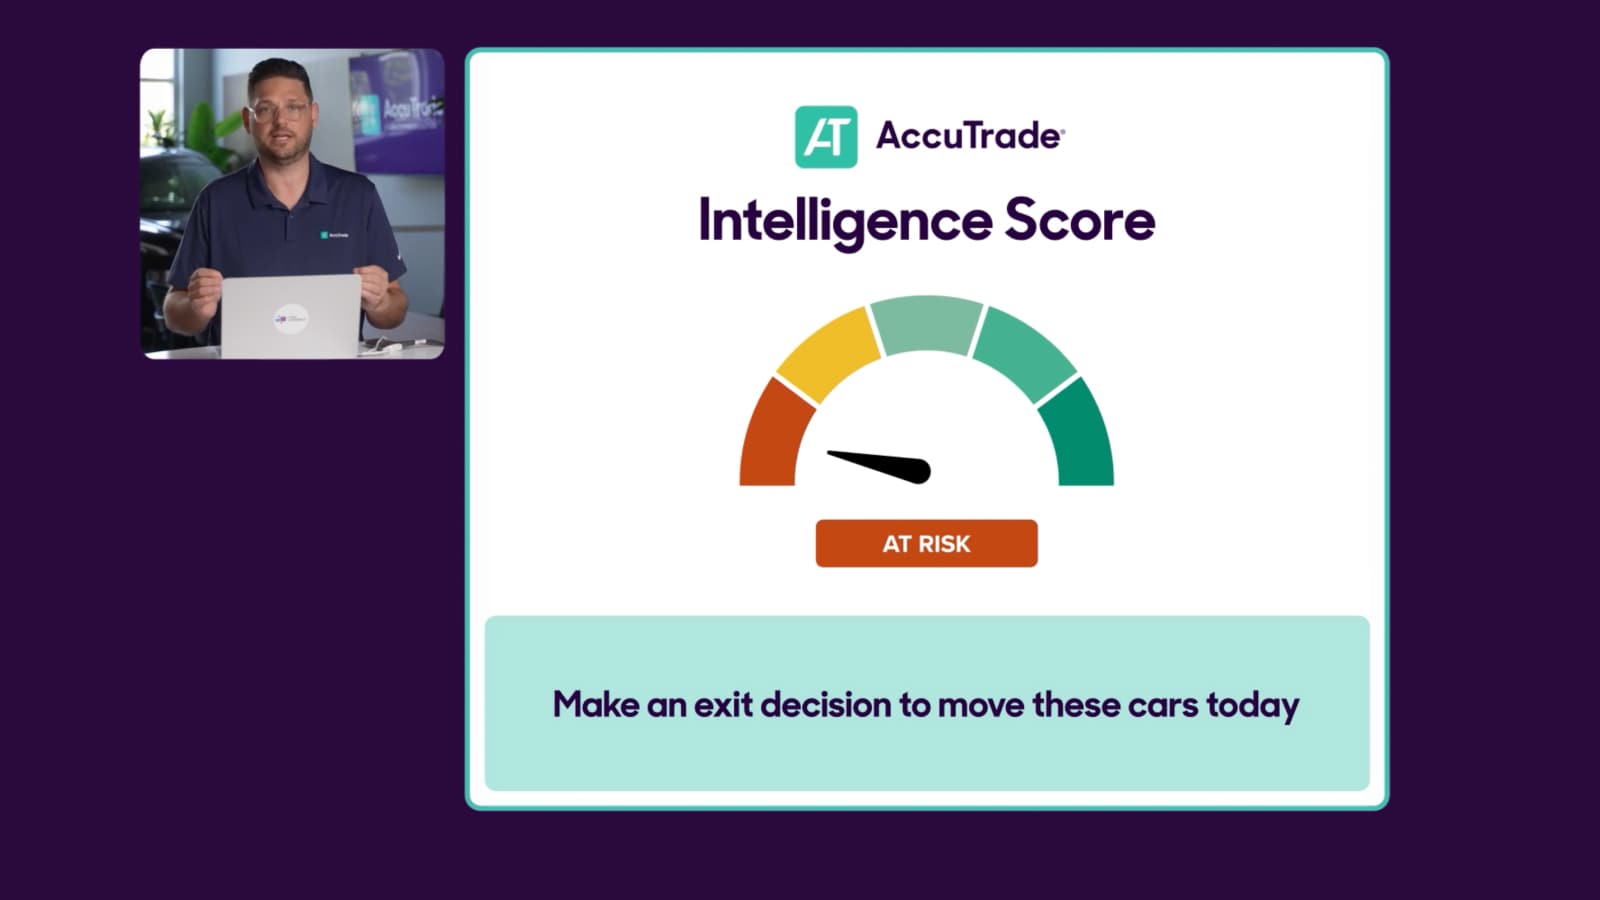
3 Understand risk with the Intelligence Score
The Intelligence Score under the Vehicle Analysis section moves you beyond age-based inventory management. Instead of just tracking days on the lot, AccuTrade predicts how quickly each vehicle will sell based on the following three factors:
- Vehicle Fit (local buyer appeal):
- Mileage appropriate for market
- Desirable color for your area
- Popular options and features
- Clean vehicle history
Example of low Vehicle Fit: High-mileage unit in an unpopular color (e.g., “Blue Glow Metallic”) with limited options.
- Market Fit (supply/demand dynamics)
- Local Days on Market (DOM) – How long similar vehicles take to sell
- Market Day Supply (MDS) – Number of days of inventory available
Example of low Market Fit:48-day MDS with 58 similar vehicles within 200 miles — high supply, lower demand.
- Dealer Fit (your historical success)
- Current stock count of this make/model
- Sales history in last 90 days
- Turn time on similar vehicles
Example of low Dealer Fit: You have 5 units in stock but haven’t sold one in 90 days.

4 Interpret score categories
- Performing: Low-risk vehicles likely to sell quickly
- Trending Up: Good vehicles with positive momentum
- Steady: Average vehicles with standard market performance
- Concerning: Higher-risk vehicles needing attention
- At-Risk: High-risk vehicles that may struggle to sell

5 Take action based on the score
At-Risk:
- Price aggressively (95% or below market)
- Consider immediate wholesale exit
- Reduce reconditioning investment
- Don’t let these age further
Concerning:
- Review and adjust pricing weekly
- Enhance merchandising (photos, descriptions)
- Consider promotional messaging
- Monitor competitive set changes
Steady:
- Maintain current pricing strategy
- Standard merchandising approach
- Monitor for category movement
Trending Up / Performing:
- Maintain or increase pricing
- Invest in premium merchandising
- Maximize profit potential
- These are your money-makers