How to access your walk-in demand report
The walk-in demand report helps you track and understand shopper activity. It reveals crucial data on users who are physically on or near your dealership lot (within 528 feet) and are actively using Cars.com on their mobile device (with location services enabled).
This insight helps you understand your walk-in traffic and the online research they completed before stepping onto your lot.
To get started
Go to the Cars.com Hub.
1 Find your reporting in the Cars.com Hub
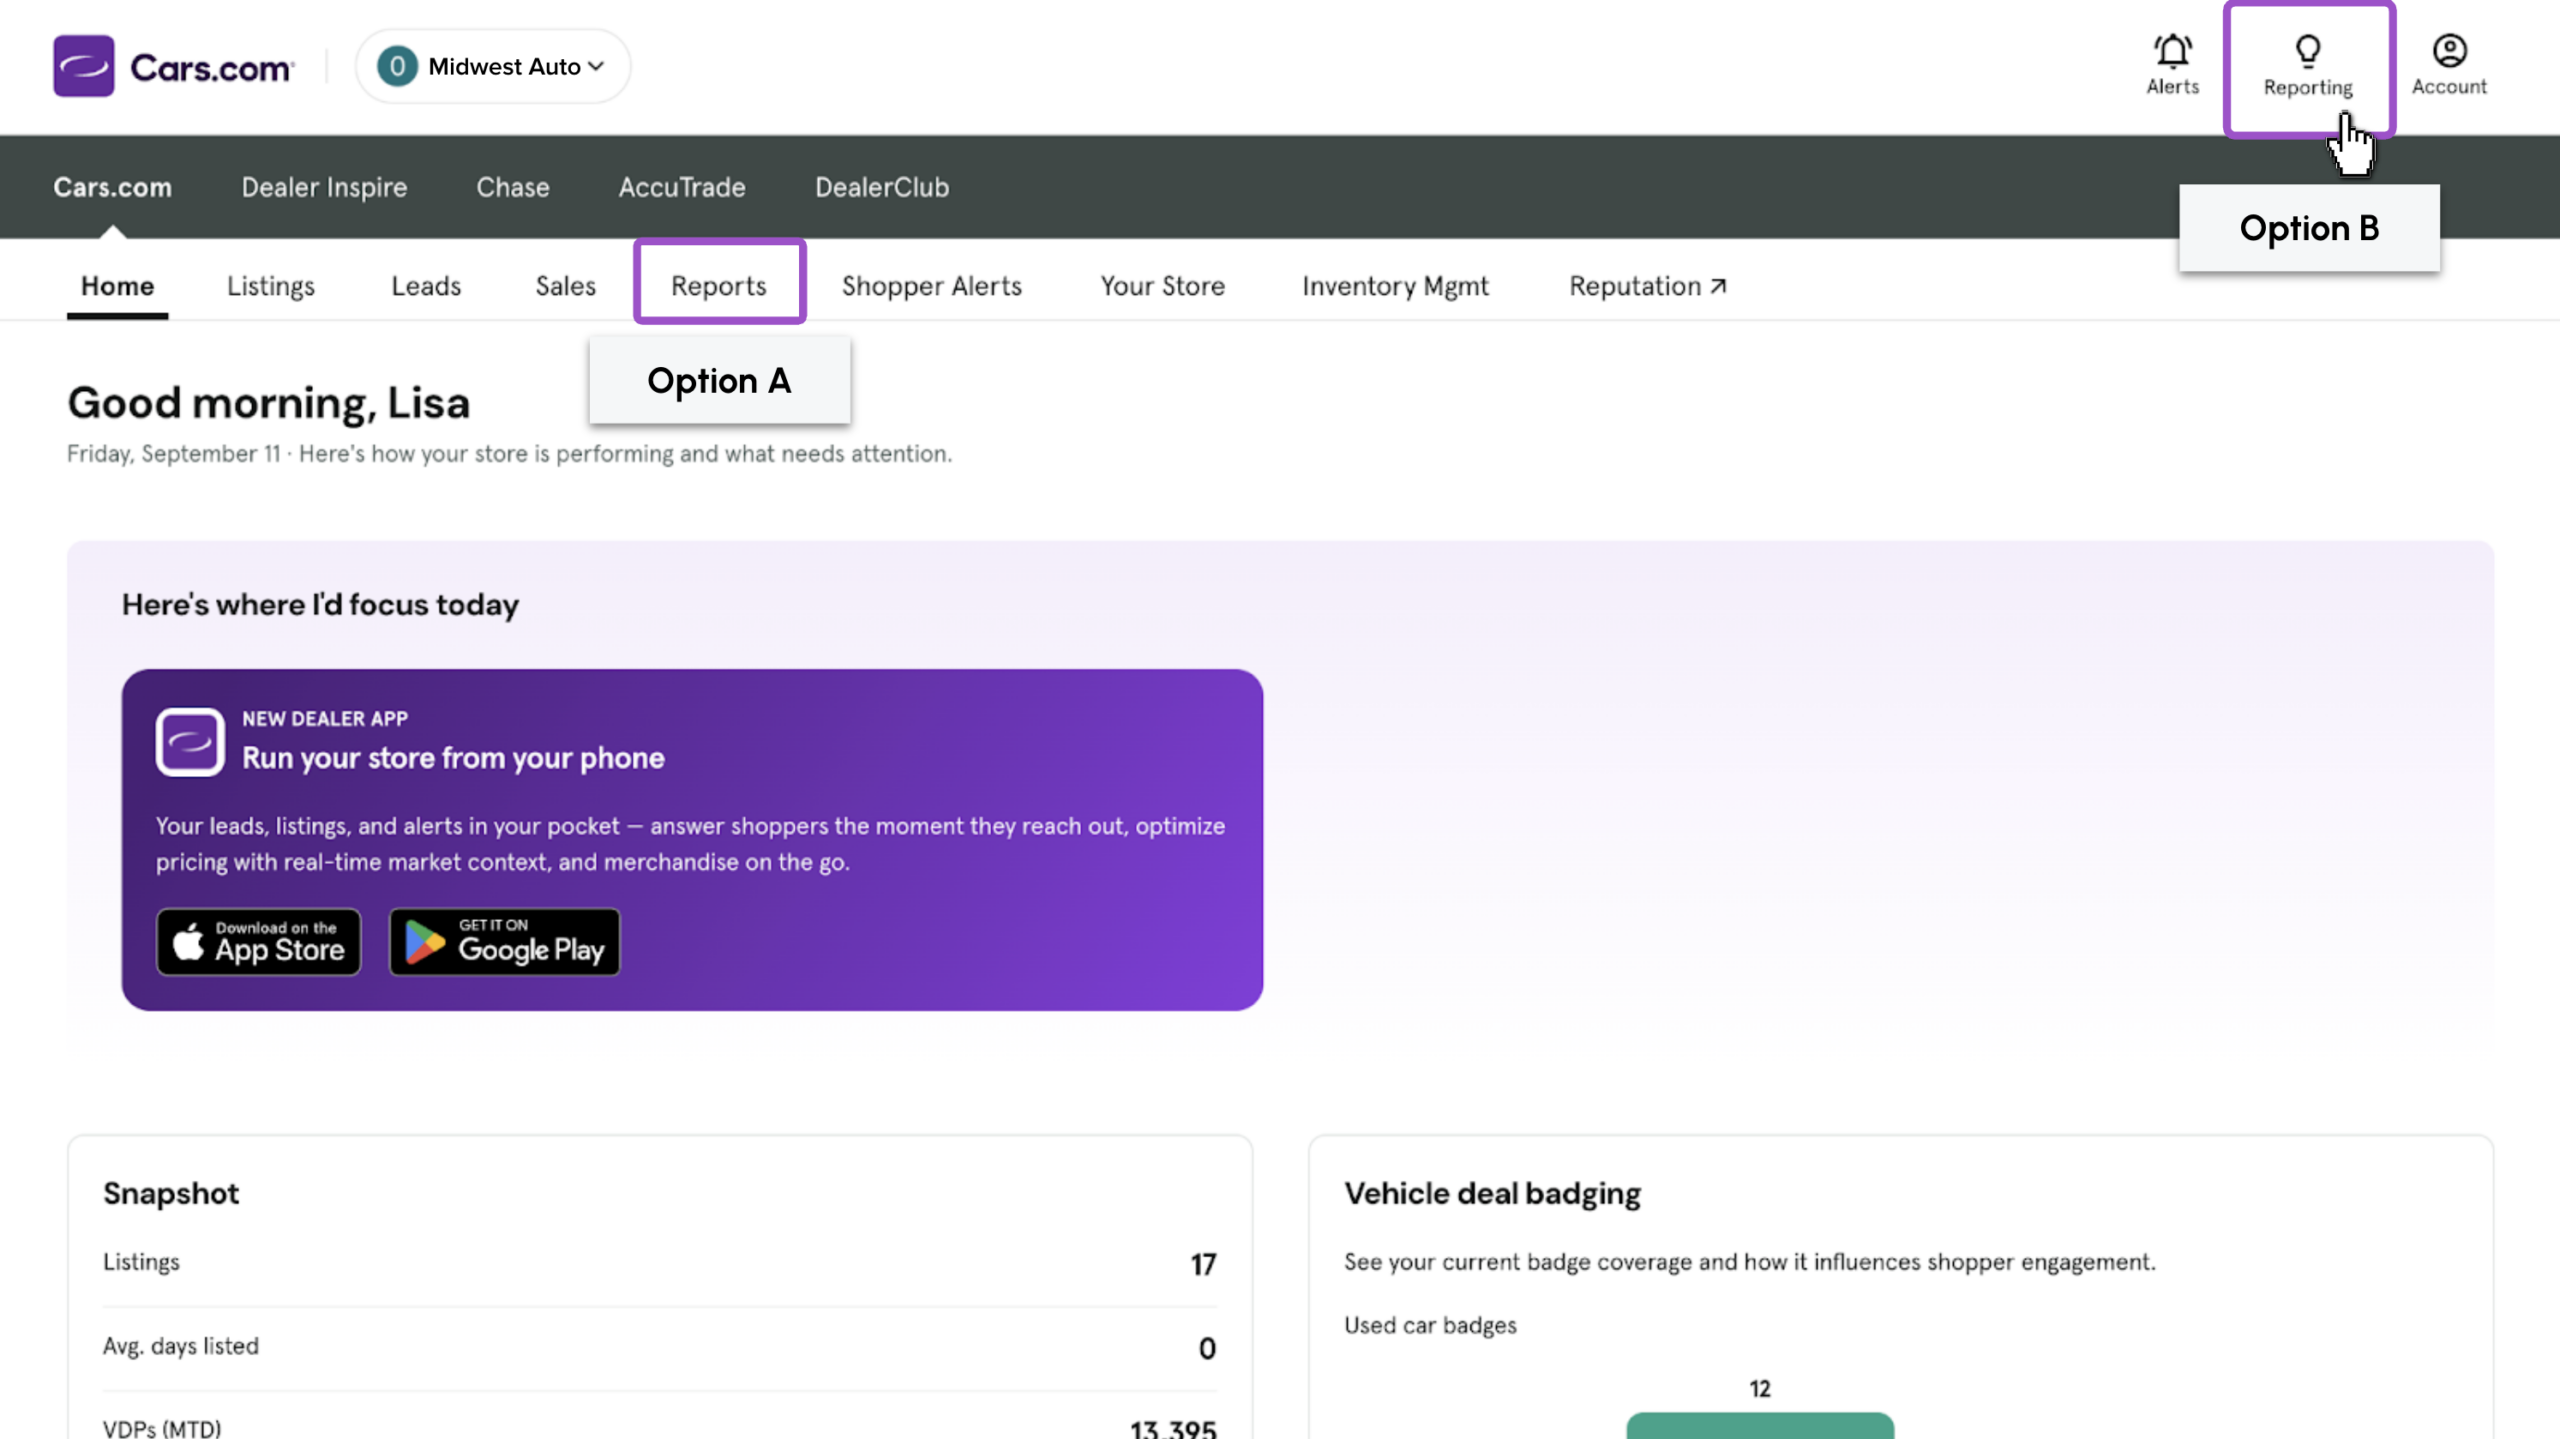
Get to your reports one of two ways:
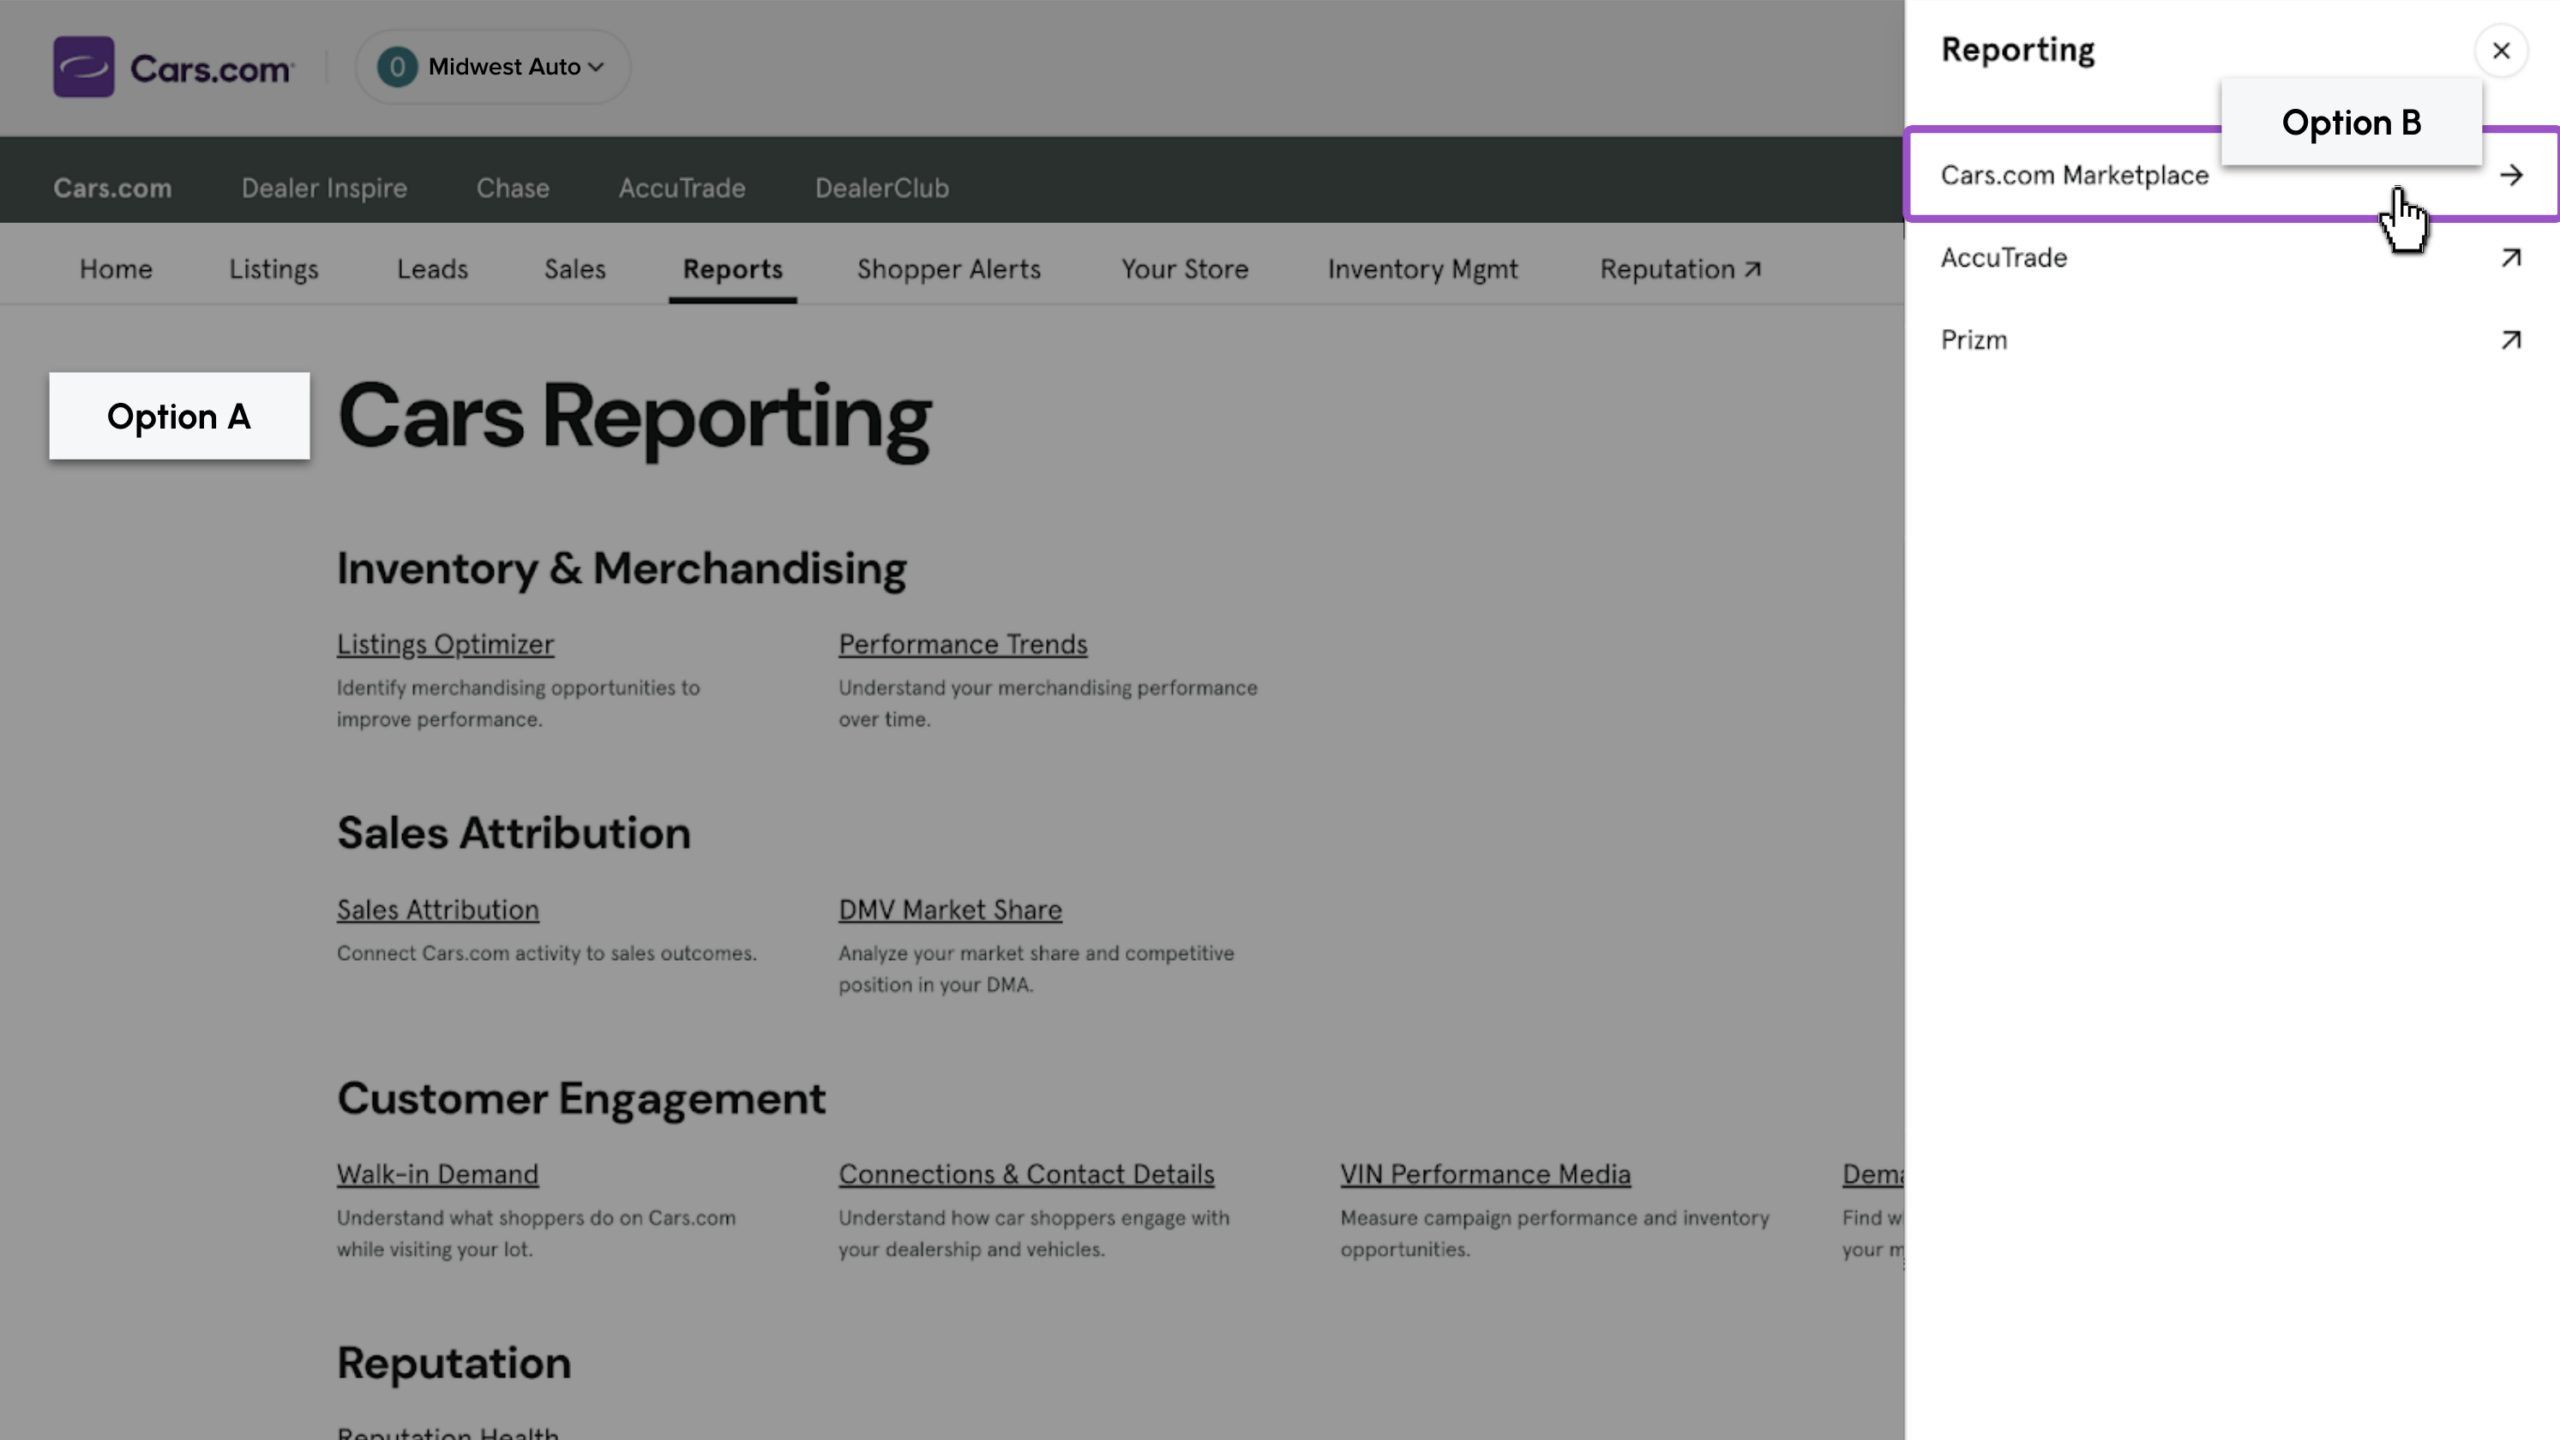
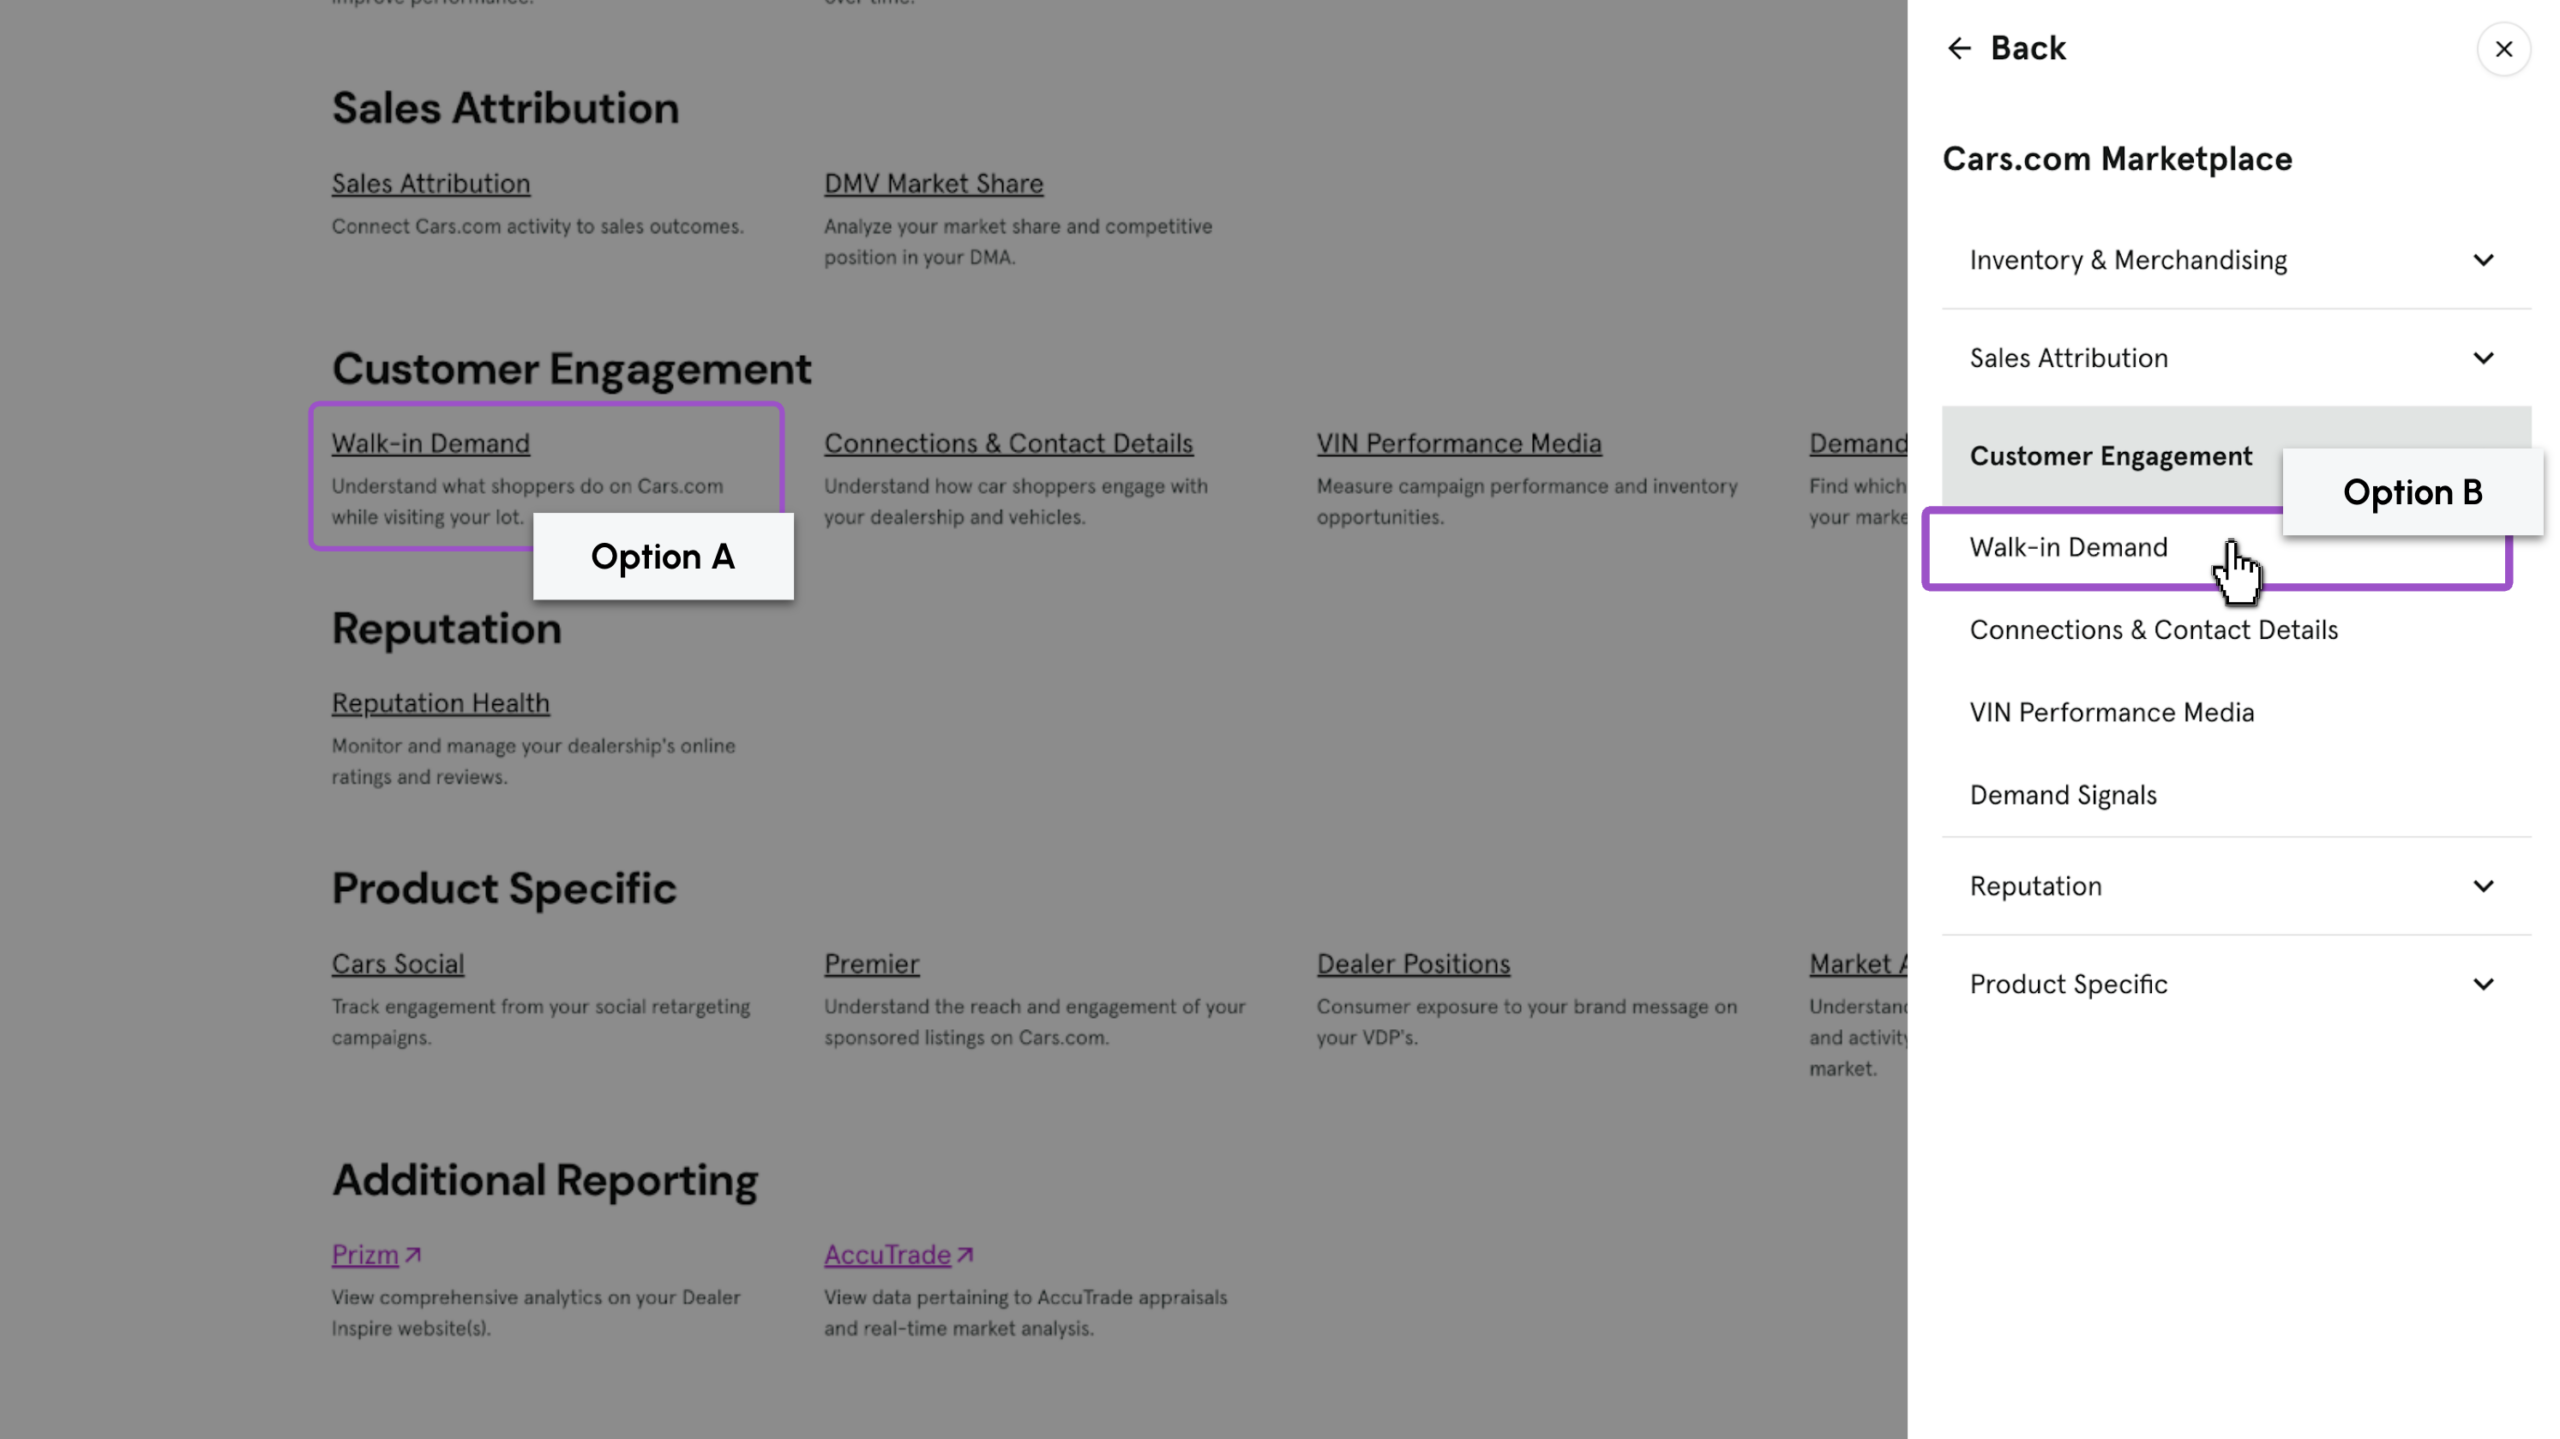
- Option A: Click the Reports tab in the top menu; it opens the full Cars.com Marketplace Reporting page directly
- Option B: Click Reporting in the top right; a panel expands with shortcuts. Click Cars.com Marketplace to open the relevant report options.
2 Select Customer Engagement
- Option A: On the Reports page locate Customer Engagement, then click Walk-in Demand
- Option B: In the Reporting panel click Customer Engagement, then click Walk-in Demand
3 Filter and review the trends summary
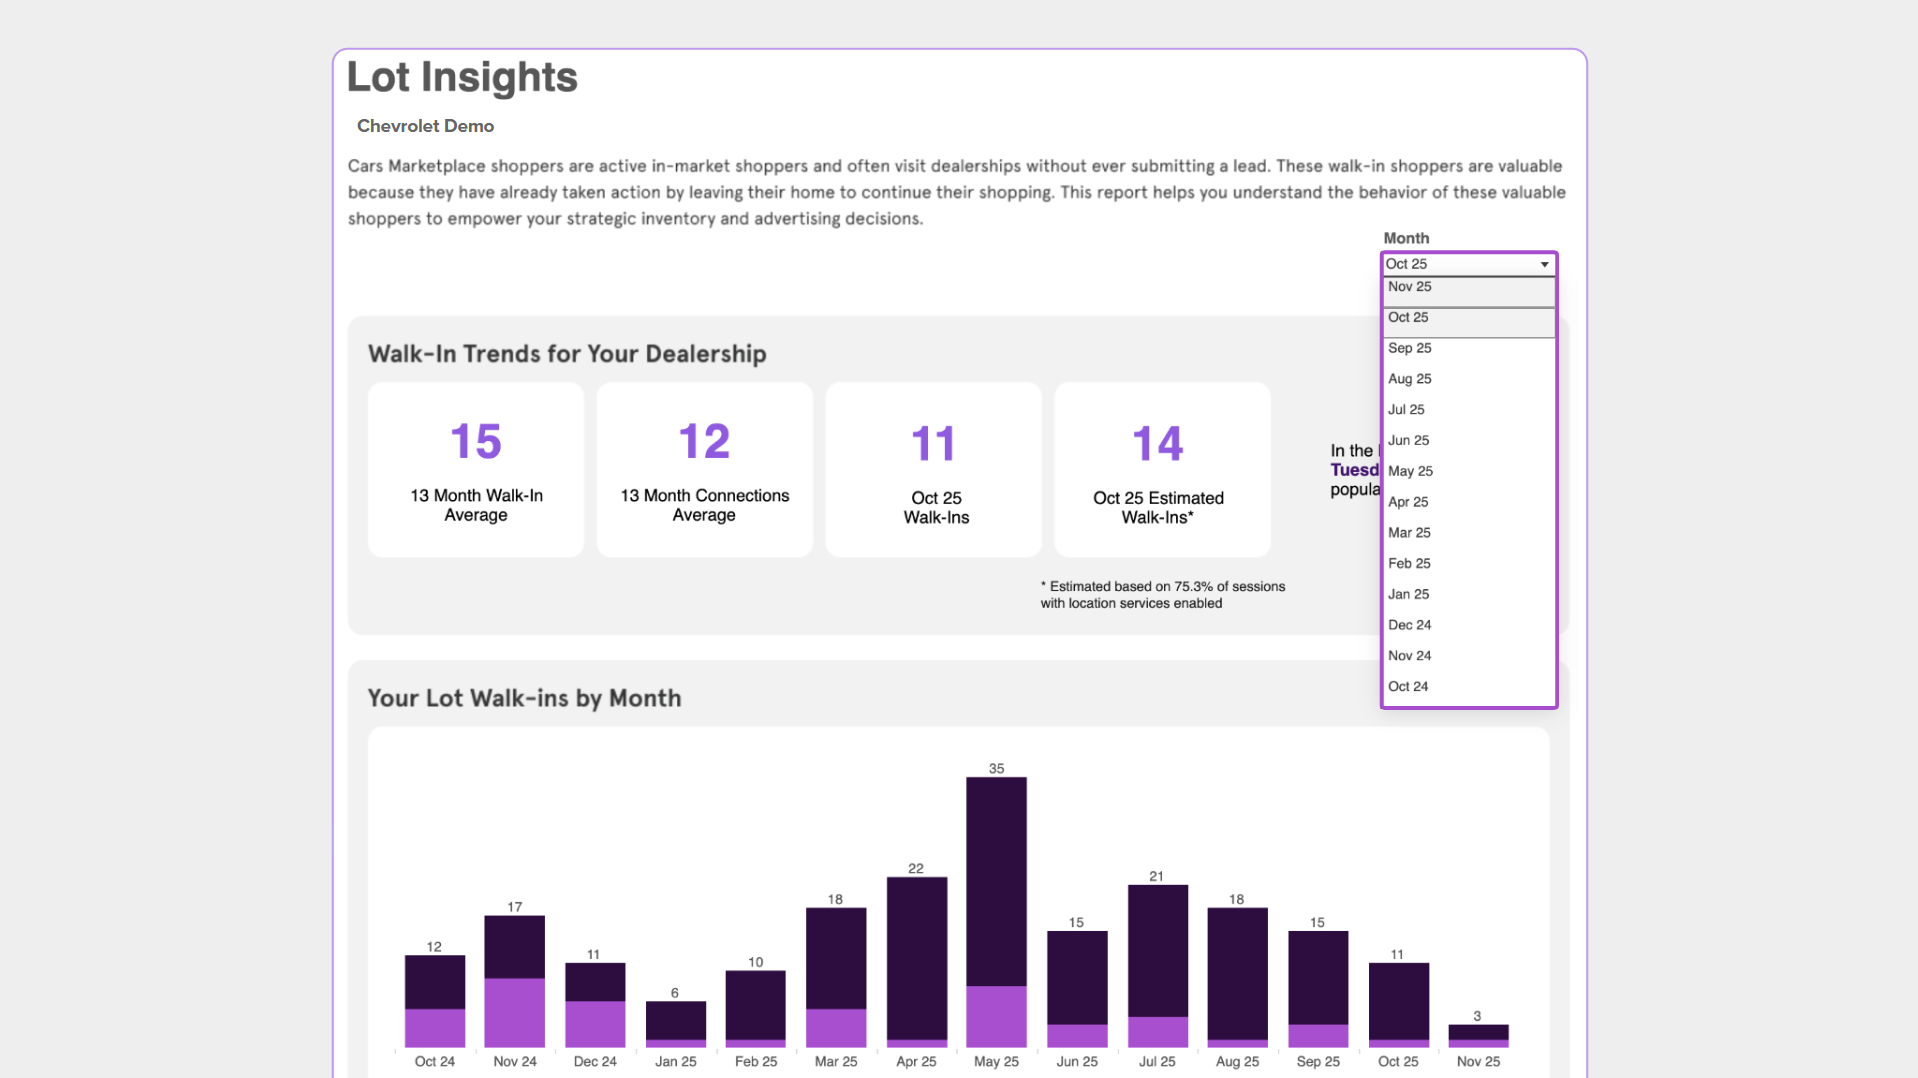
Filter the report by month, and see a snapshot summary of overall walk-in trends and connections.
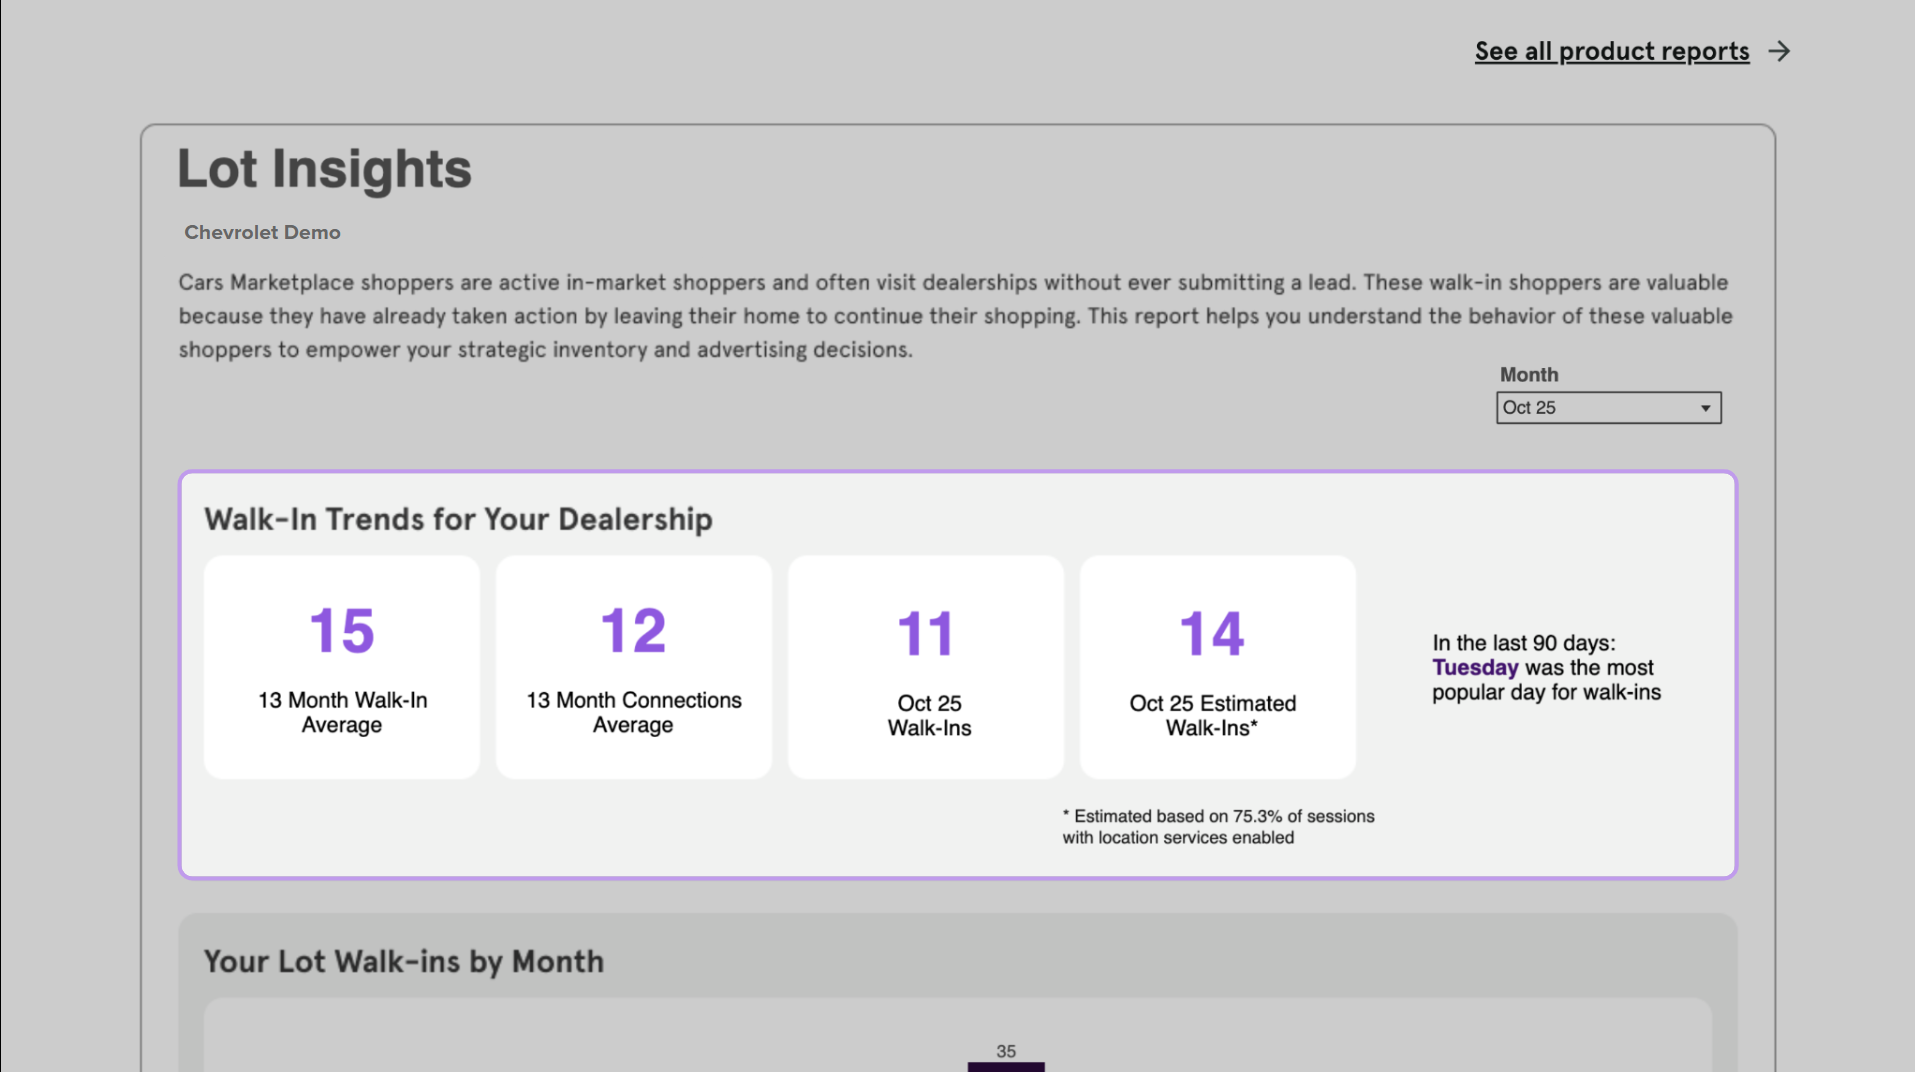
This section quantifies how many shoppers visit your lot and their most popular day to visit.
Actionable Insights
- Use the 13 Month Walk-in Average to benchmark monthly performance and identify seasonal trends.
- Staff your lot accordingly on your most popular day for walk-ins to maximize in-person sales opportunities.
Keep scrolling down the report for more granular insights.
4 Leverage the walk-in demand data
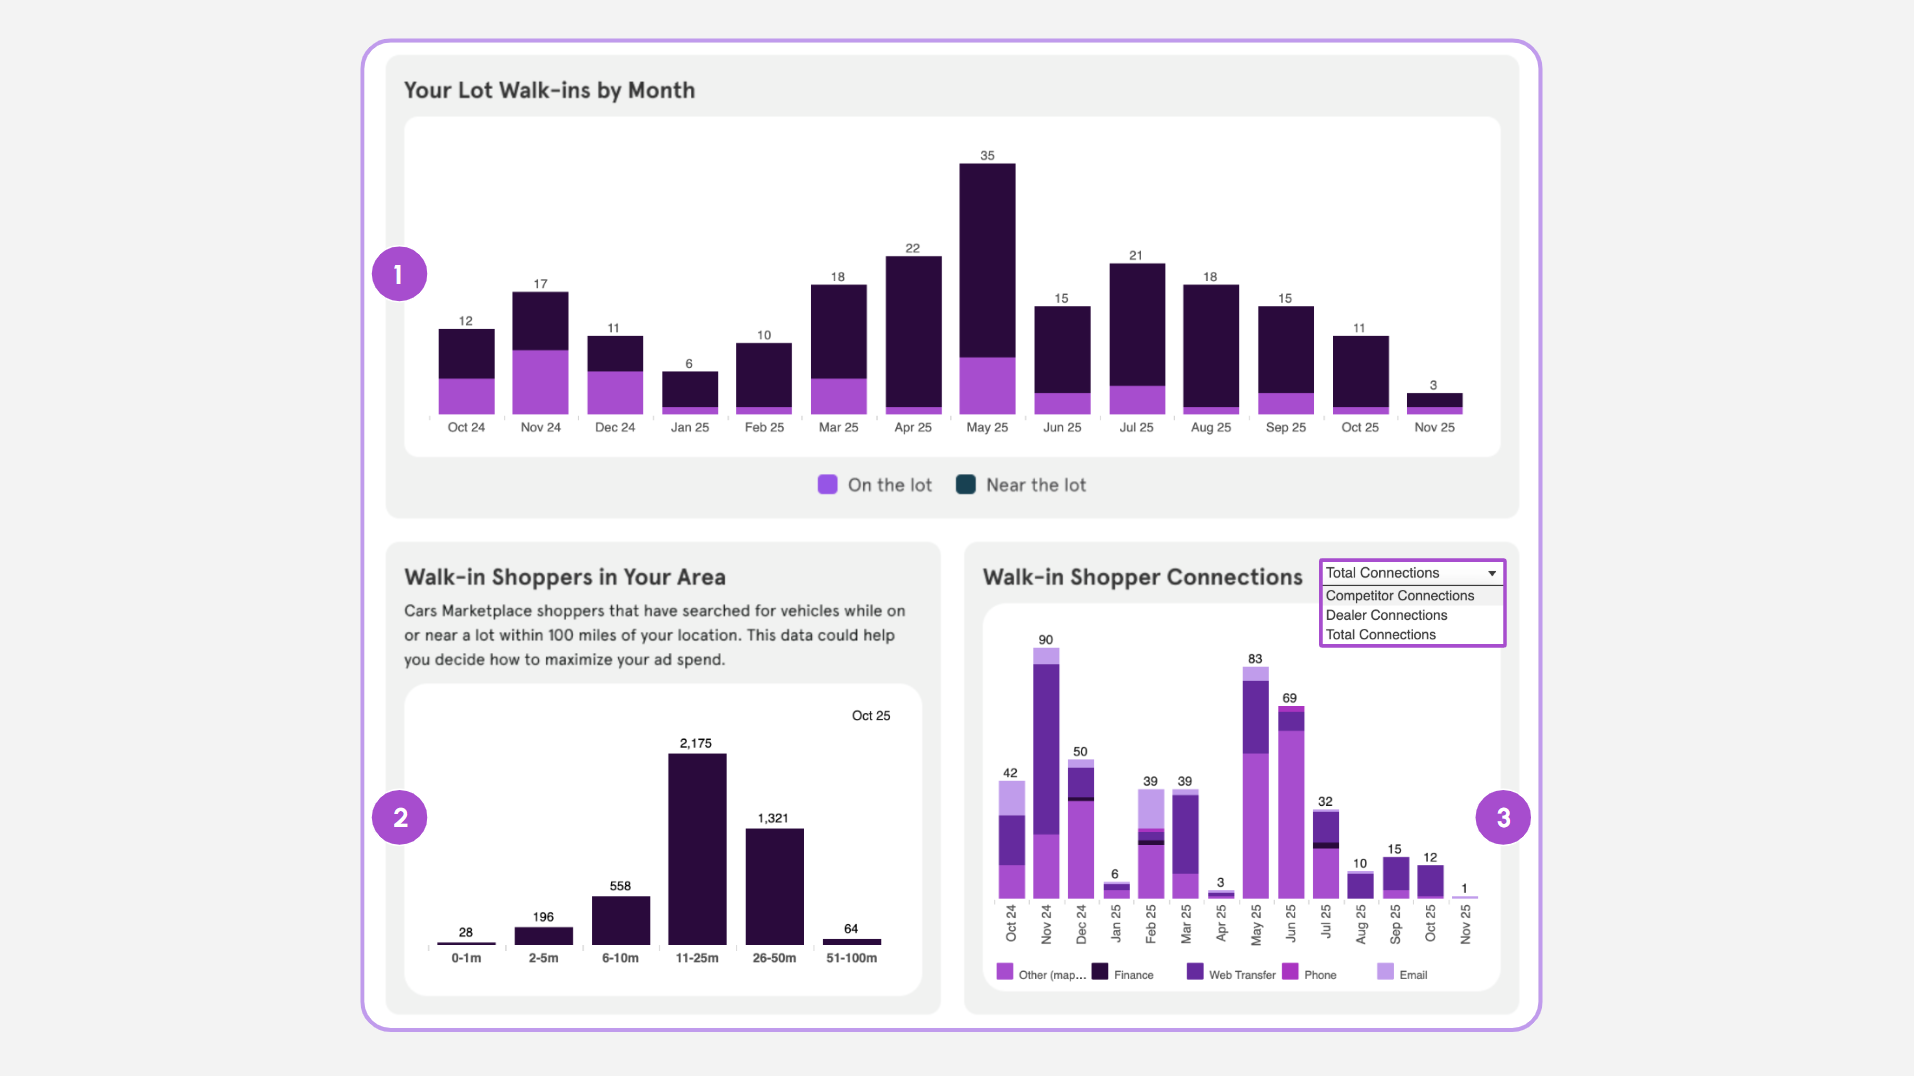
- Walk-ins by Month
Use the bar chart to get insight into the amount of shoppers on your lot or near your lot per month for the last year.
- Walk-in Shoppers in your Area
This section details shoppers who searched for vehicles on Cars.com while on or near any lot within a 100-mile radius of your location.
Use This Data To:
- Maximize Ad Spend: Understand the geographic distribution of competitive shoppers.
- Conquest Competitors: Identify areas where potential customers are actively shopping at other dealerships nearby.
- Walk-in Shopper Connections
This feature showcases the actions (Connections) taken by walk-in shoppers after they arrive at your dealership.
- Total Connections (Default): All connections from on-the-lot (OTL) and near-the-lot (NTL) shoppers, including connections on other dealers’ inventory. Key takeaway: The total volume of action the shopper took while visiting your area.
- Dealer Connections: Only connections made on your dealership’s inventory. Key takeaway: Measures engagement directly with your stock while the shopper is physically present.
- Competitor Connections: Only connections made on other dealers’ inventory. Key takeaway: Measures how many shoppers are using your lot as a comparison point for other dealers’ vehicles.
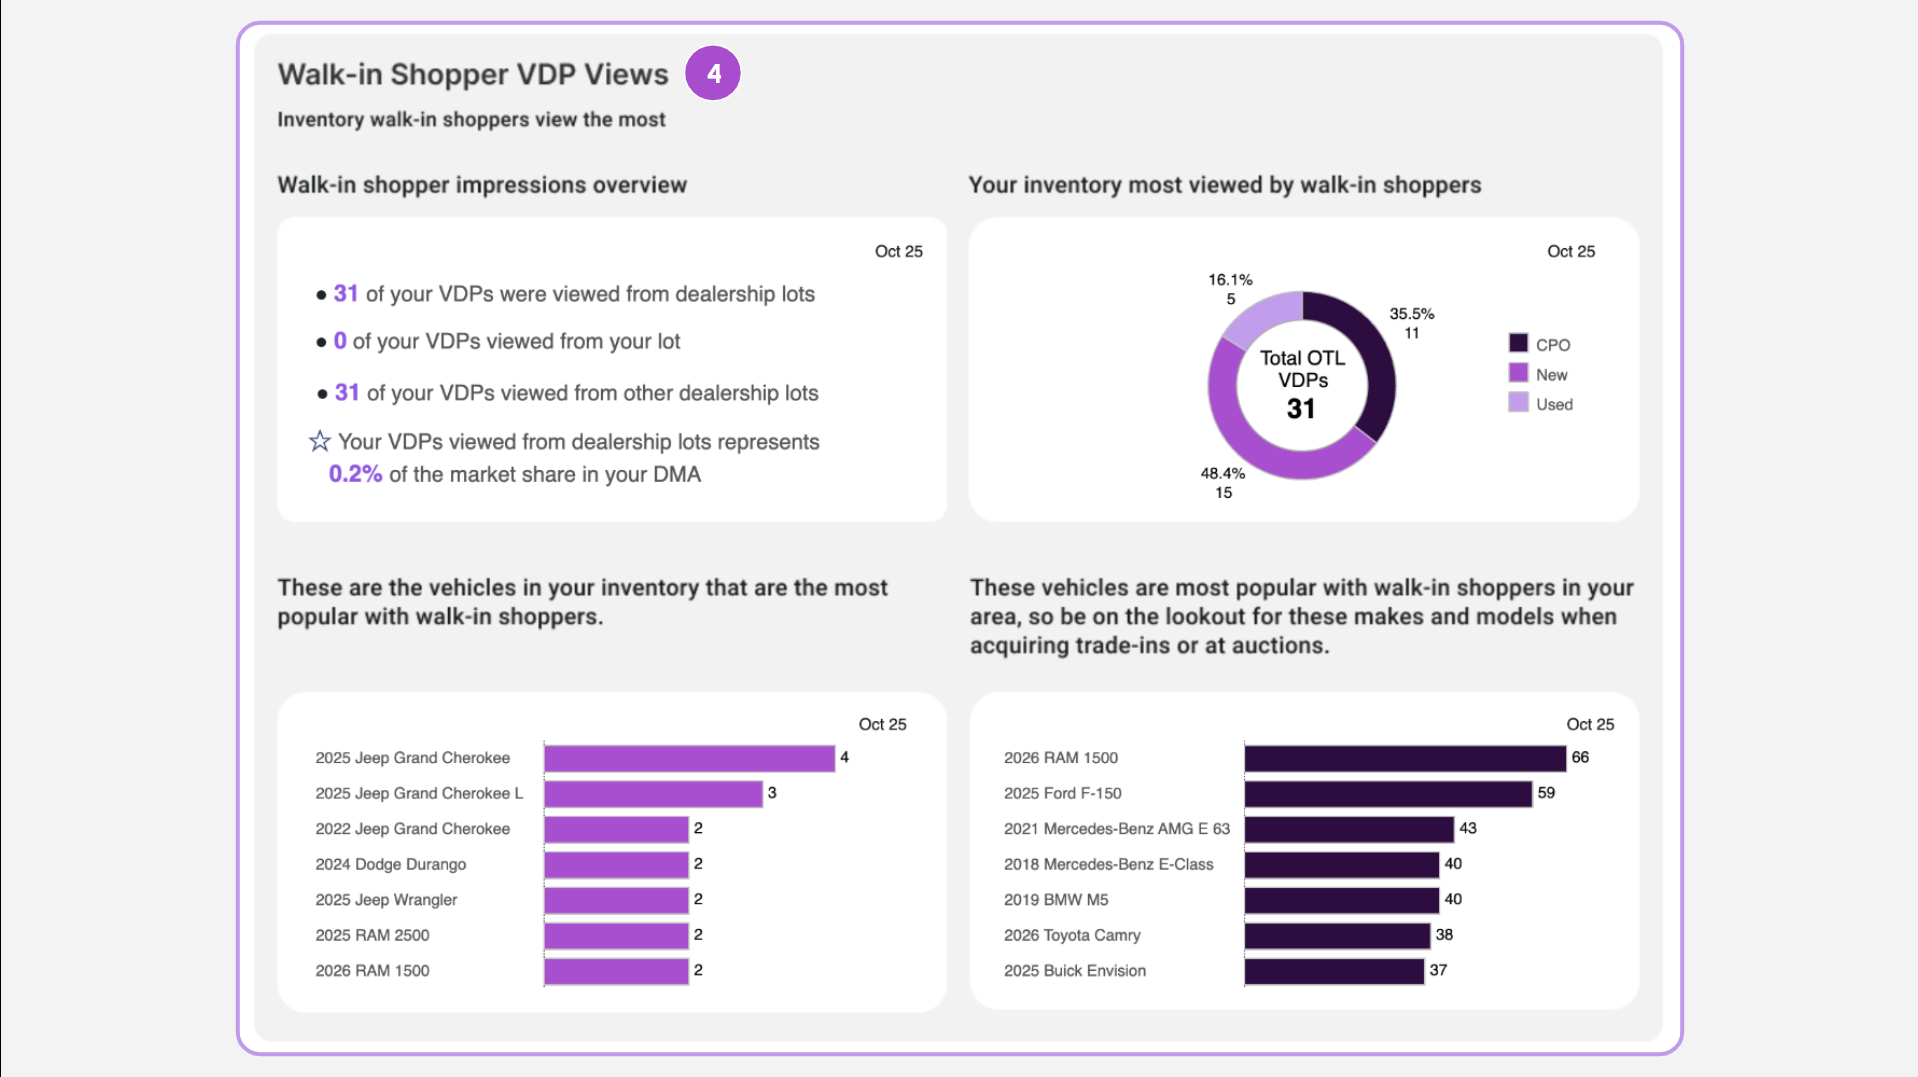
- Walk-In Shopper VDP Views
This section highlights what walk-in shoppers are viewing and how your VDPs compare to the market.
- Your Inventory Impressions: The report displays the number of Vehicle Detail Page (VDP) impressions on your inventory made by visitors while on or near your store or any other lot.
- VDP View Breakdown: The report shows how many of your VDPs were viewed from your lot, viewed from other dealership lots, and the total viewed from all dealership lots.
- Market Share: It shows your VDP views from dealership lots as a percentage of the market share in your DMA (Designated Market Area).
- Vehicle Type: Impressions are broken down by New, Used, and Certified Pre-Owned (CPO).
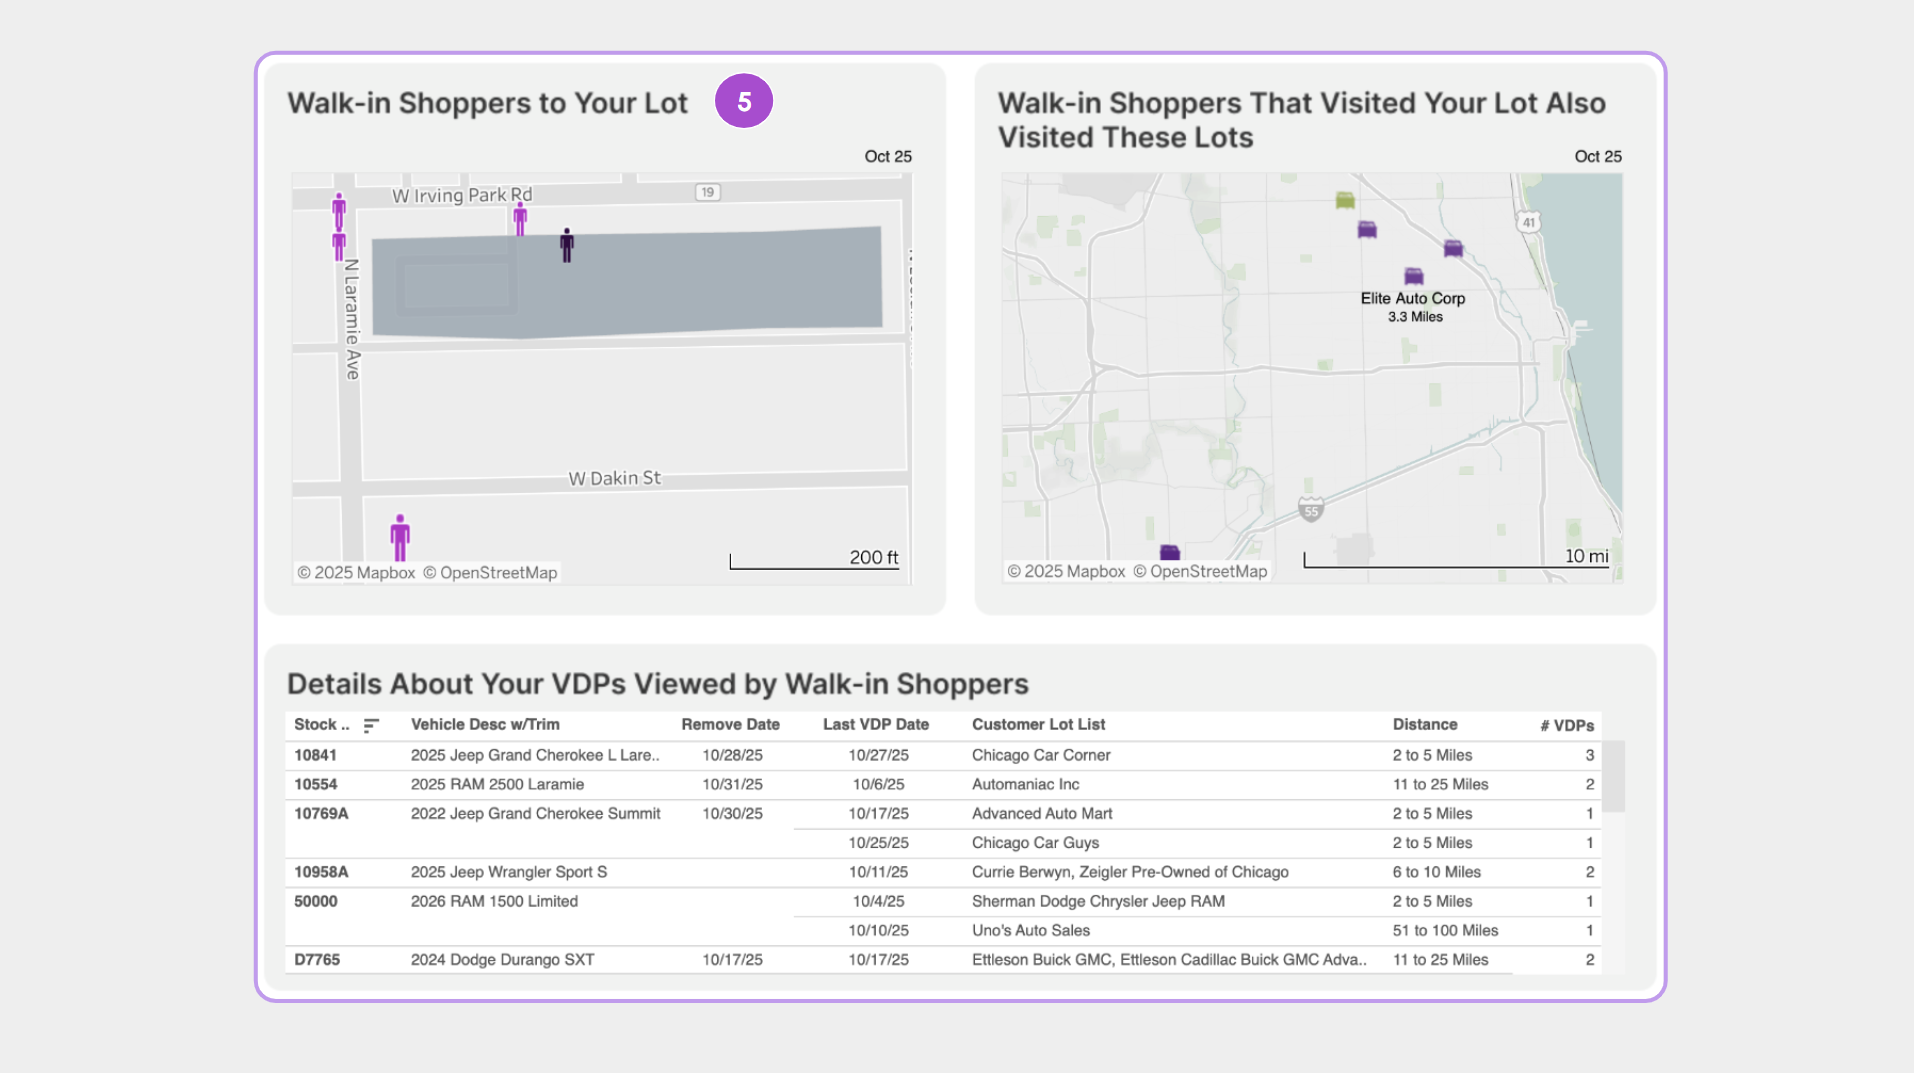
- Walk-in Shopper Maps and VDP Details
These elements provide spatial context and granular detail on the specific vehicles shoppers are viewing.
- Lot Map: A map of your lot showing the location of users who were on or near the lot.
- Hovering over the icons reveals the last date/time the shopper was recorded and the total number of visits during the month.
- Hovering over the icons reveals the last date/time the shopper was recorded and the total number of visits during the month.
- Competitive Lot Map: This map displays your dealership location and any other dealership lots that your walk-in shoppers visited during the month.
- Details About Your VDPs: This table shows the top-viewed vehicles in your inventory by lot visitors.
- It includes the stock number, vehicle details, removal date (if applicable), last VDP view date, the customer’s lot list, and the distance from your location.
Acquisition Strategy
- The report identifies popular make/models that walk-in shoppers are searching for across your DMA.
- Action: Be on the lookout for these popular makes and models when acquiring trade-ins or sourcing inventory at auction.