How to access your Premier report
Premier drives in-market shoppers to your VDPs and your website by surfacing the most relevant vehicles and dealer information that match the shopper’s search. Use your Premier report to get a granular analysis of how your investment in a sponsored listing builds awareness for your dealership, even while local car shoppers are viewing your direct competitor’s inventory. Your Premier ad appears at the top of every Search Results Page (SRP) based on the make of the vehicle and area.
To get started
Go to the Cars.com Hub.
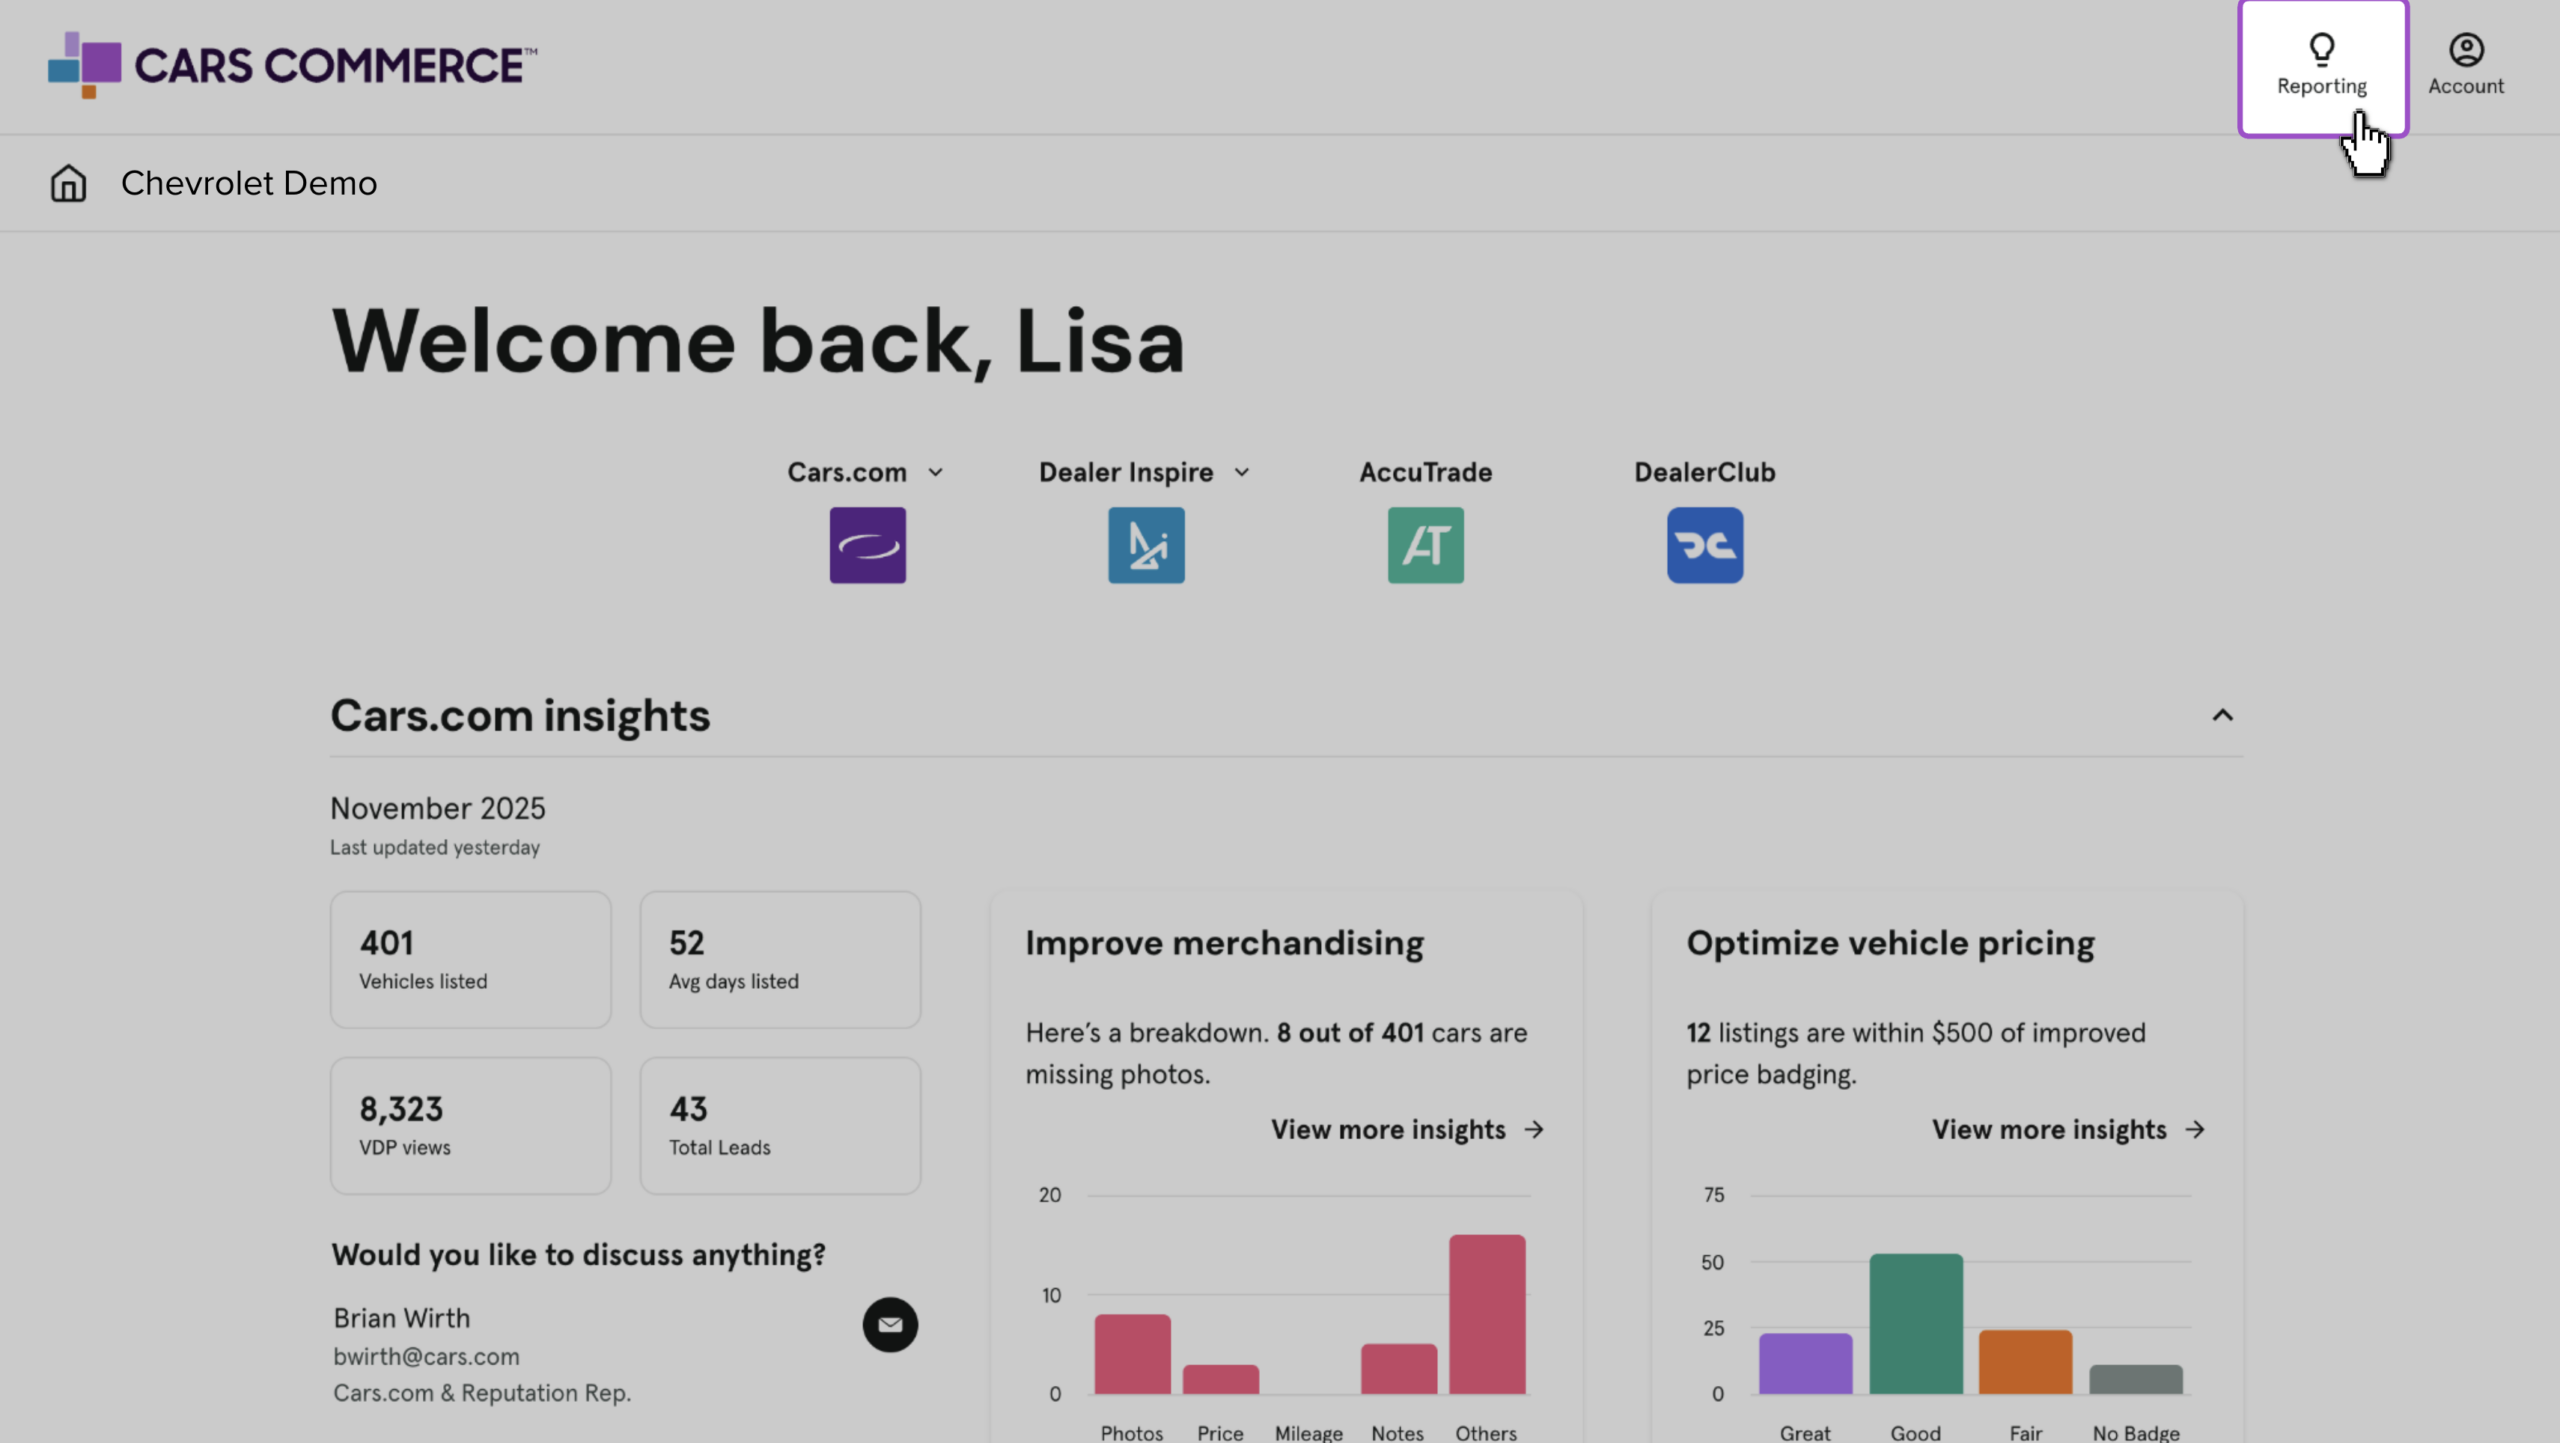
1 Find your reporting in the Hub
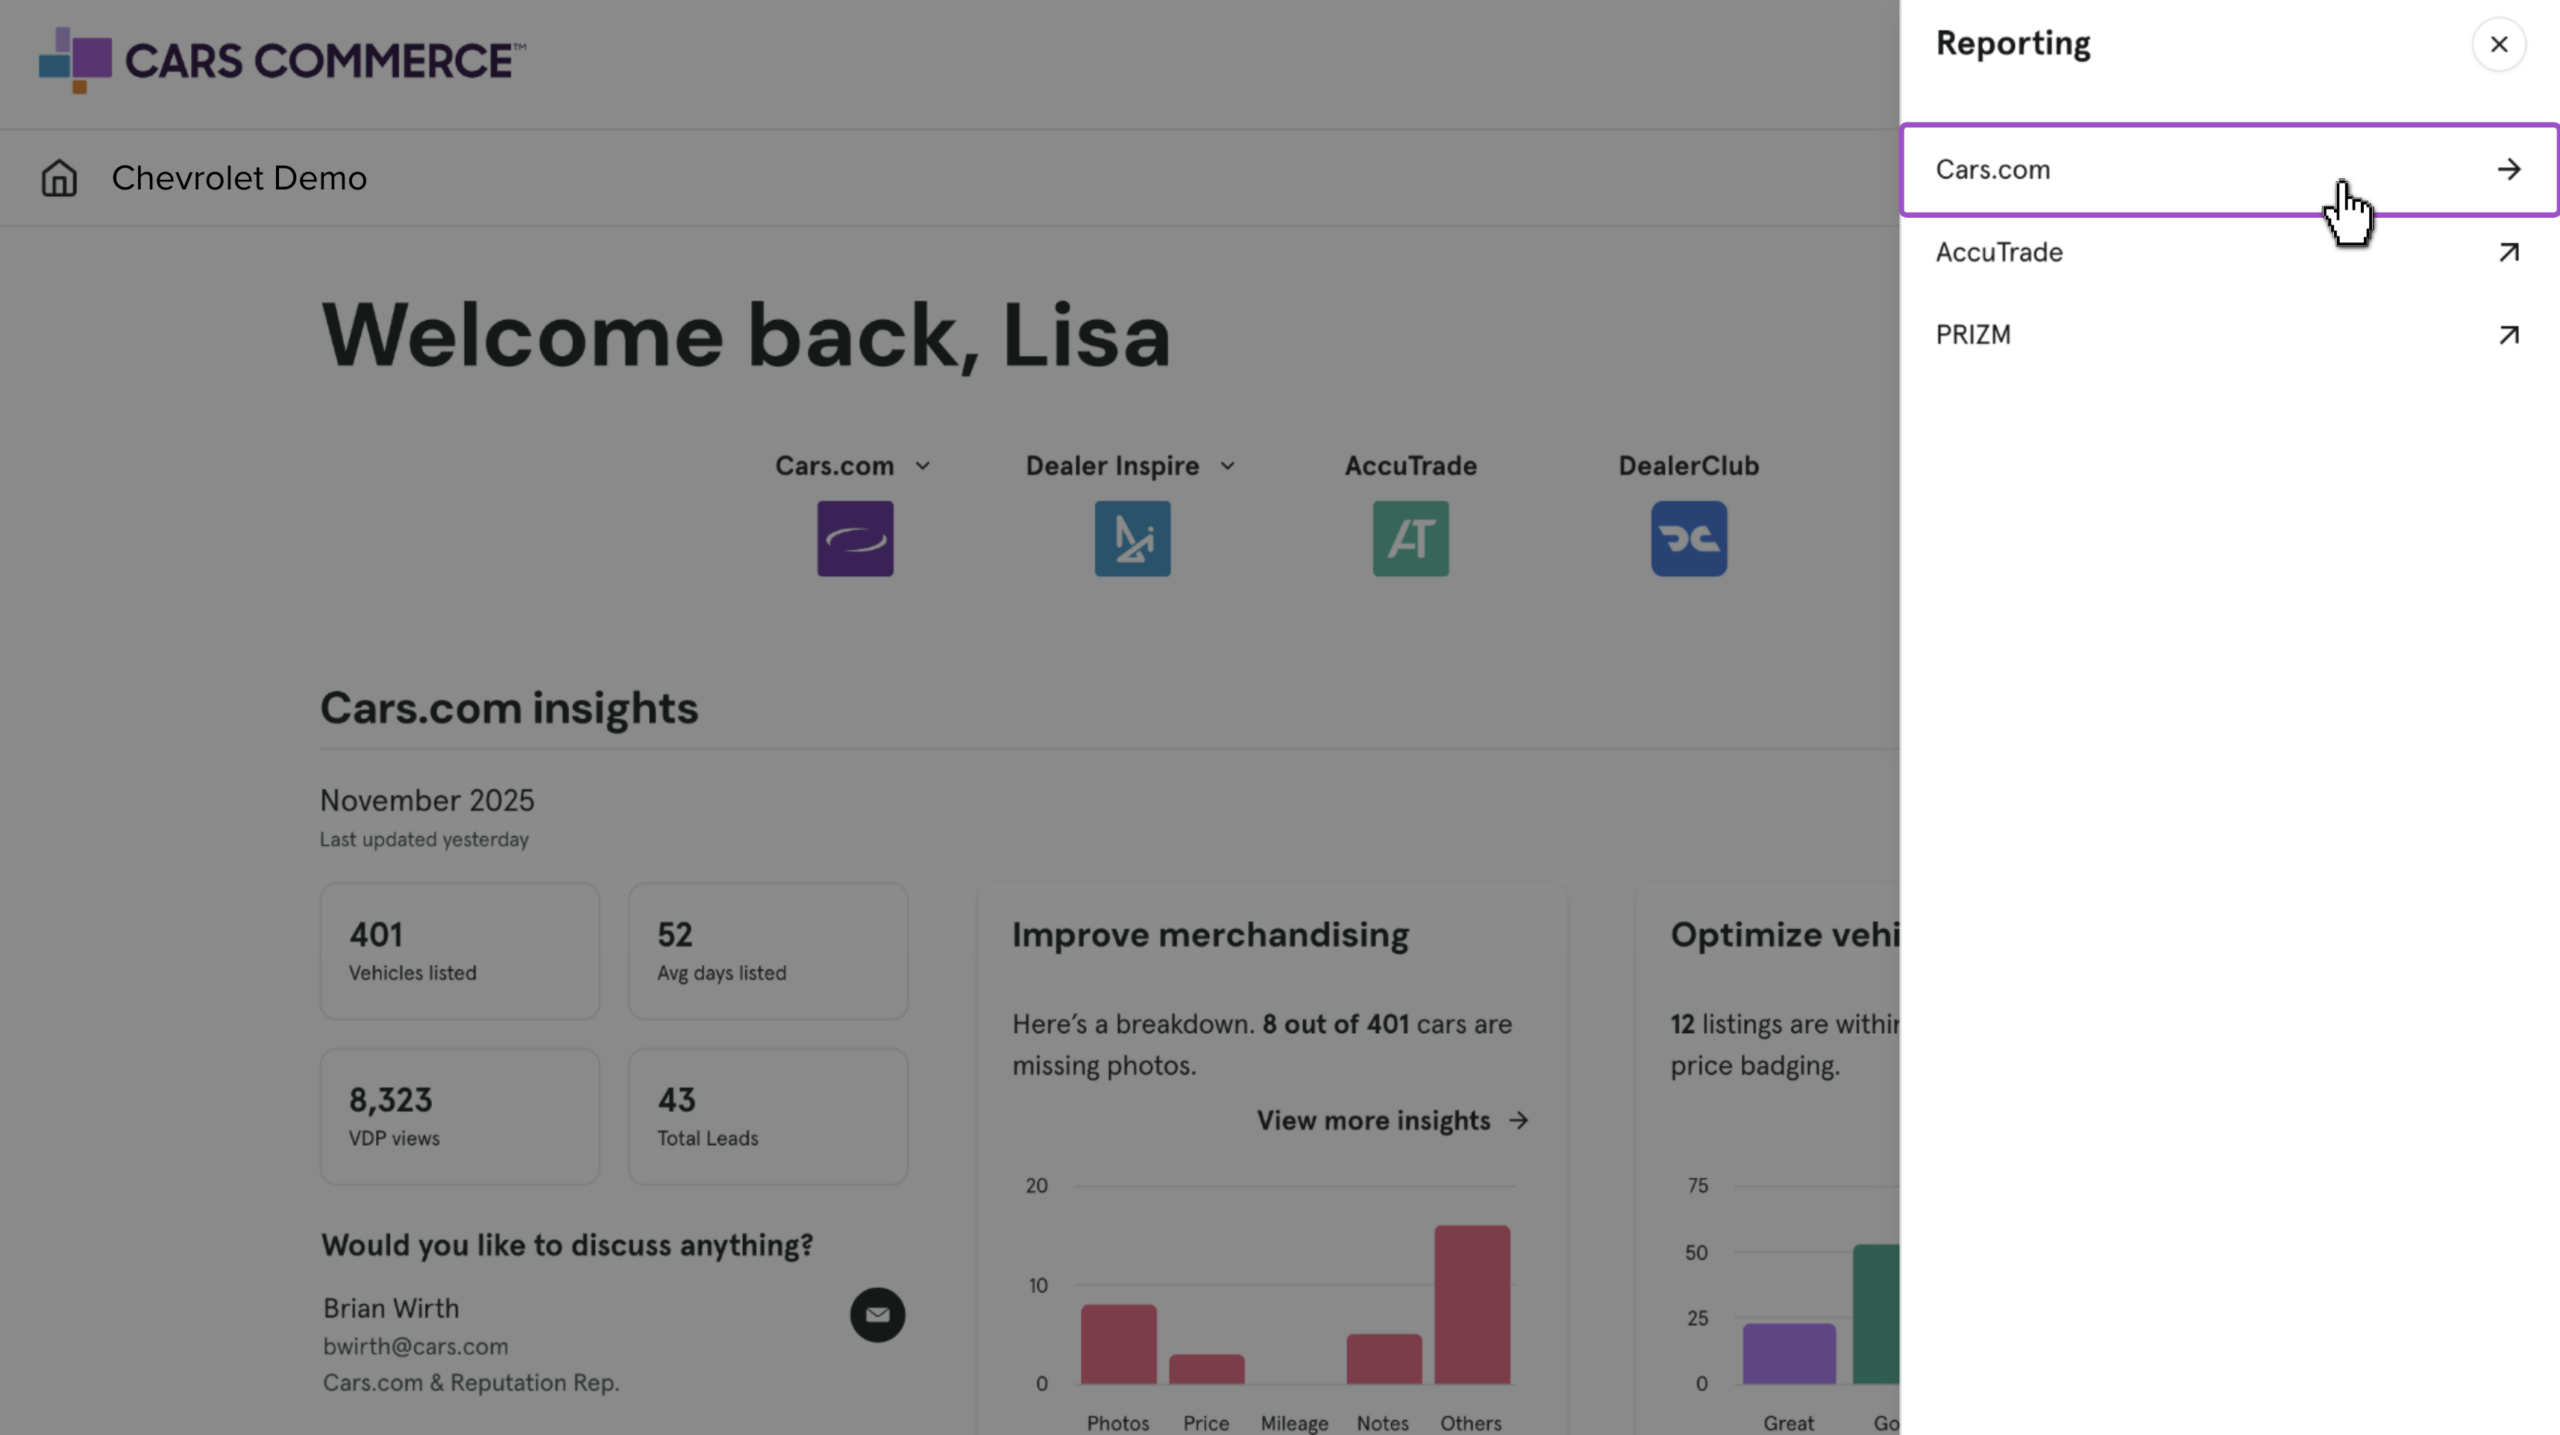
Once logged into the Hub, click Reporting, then Cars.com.
2 Select Product Specific
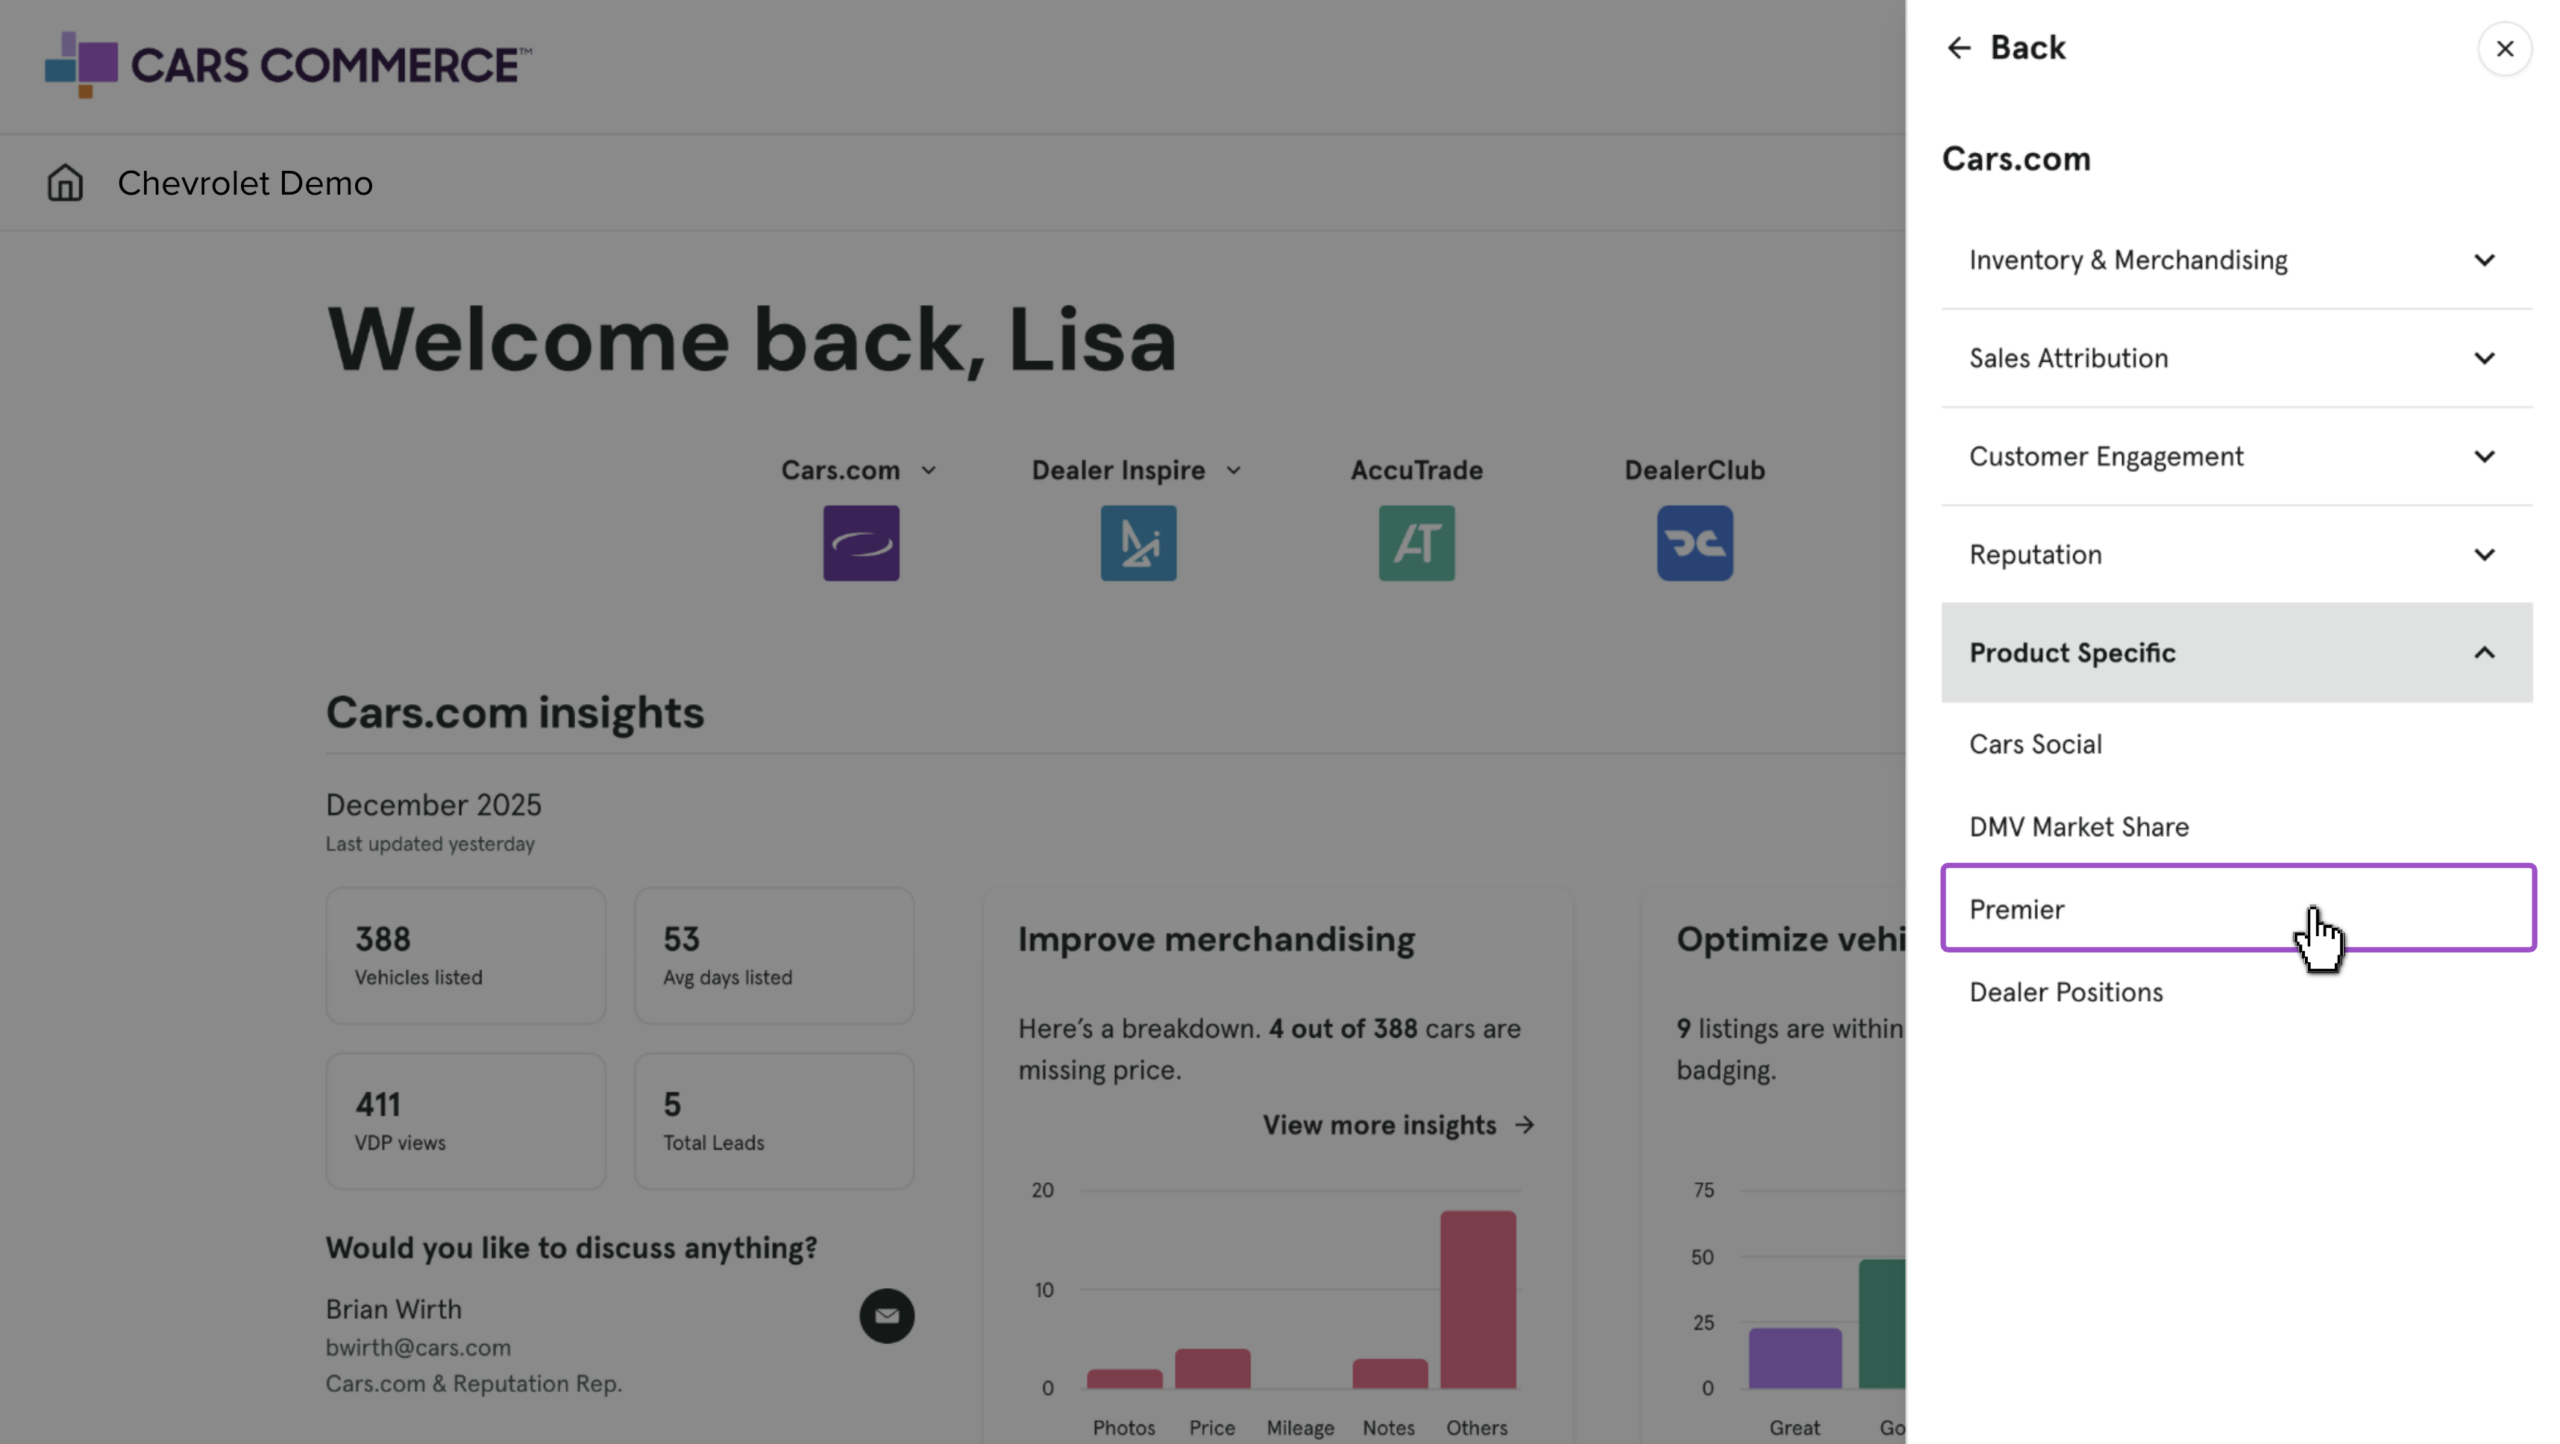
Click Product Specific, then the Premier report from the dropdown.
3 Filter your data and gain quick insights
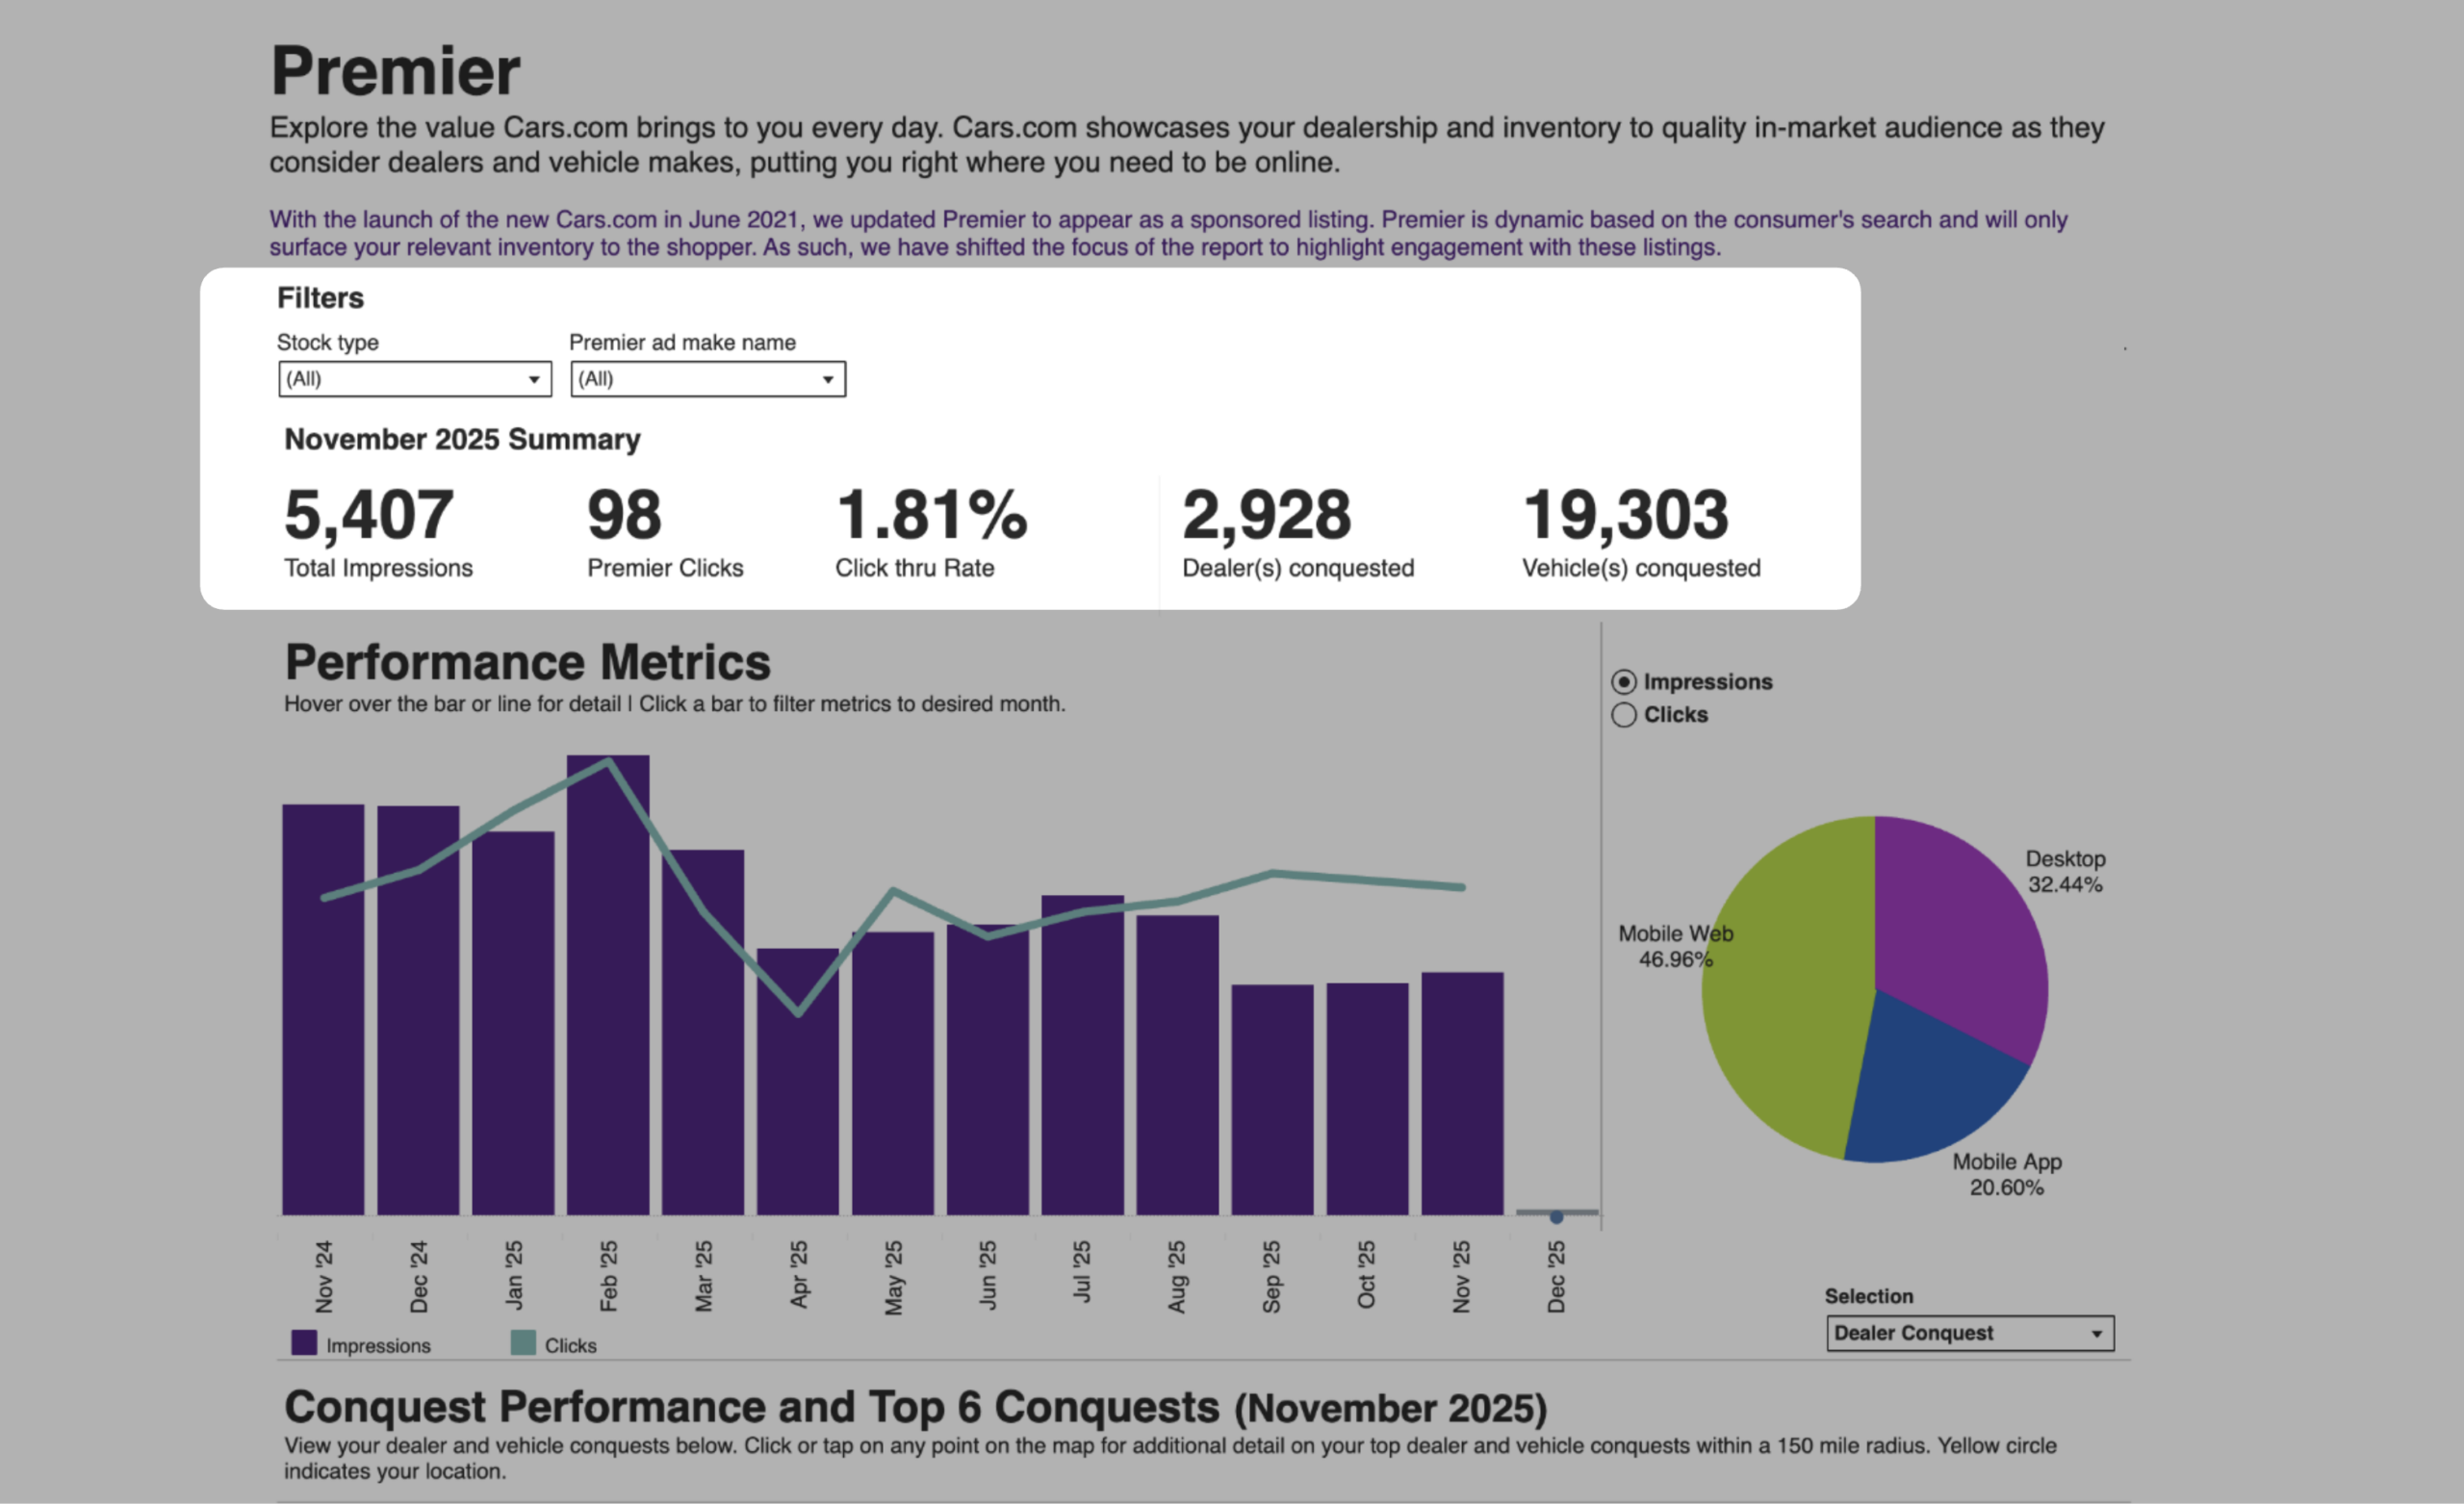
Use the filters at the top of the report to refine your results:
- Stock Type: Toggle between New or Used vehicles
- Date Range:
- Month-to-date
- Previous full month (default)
- 13-month trending view
- Month-to-date
- Make: Select one or more vehicle makes if you have purchased Premier placements for multiple makes
Snapshot summary
The snapshot summary displays metrics for the previous full month by default.
- Total Impressions:
Number of times your Premier ad was displayed on search results pages (SRPs) - Premier Clicks:
Number of times shoppers clicked on your Premier ad - Click-Through Rate (CTR):
Premier Clicks ÷ Total Impressions - Dealers Conquested:
Number of competing dealerships whose inventory appeared below your Premier ad on the SRP - Vehicles Conquested:
Number of competitor vehicles that were displayed below your Premier ad on the SRP
4 Review Premier performance data
Performance Metrics
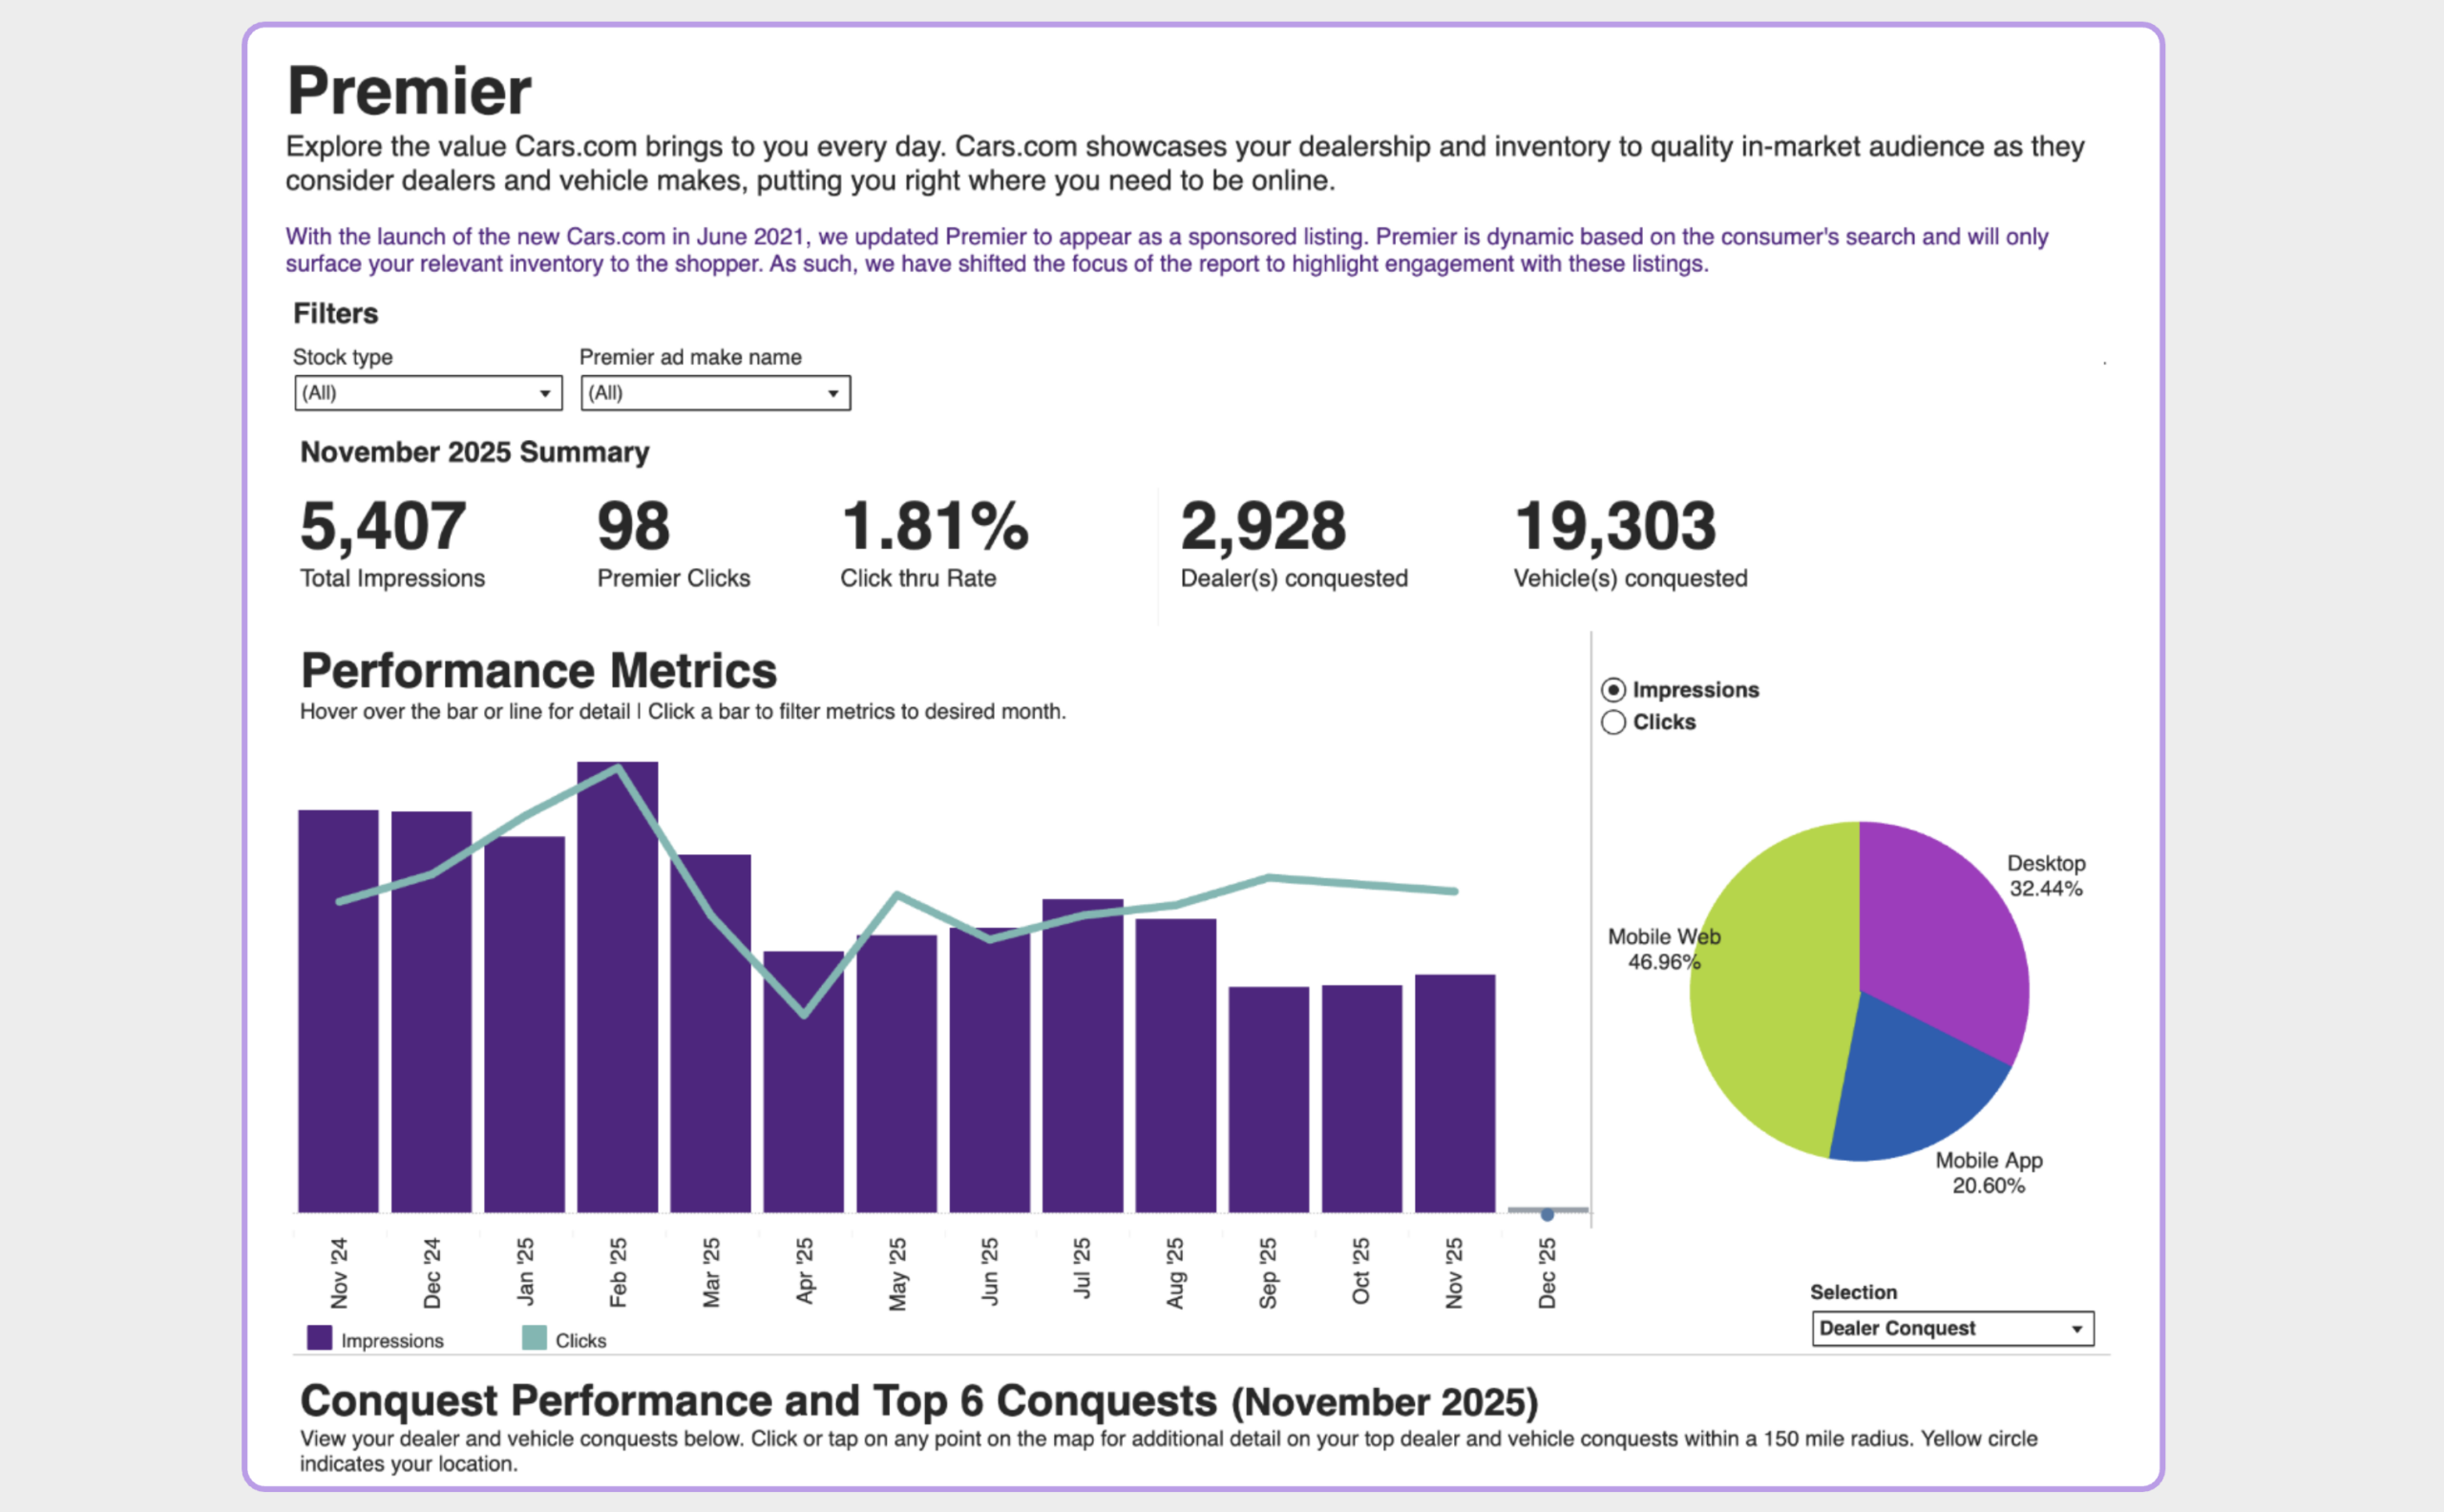
The Performance Metrics section shows long-term performance trends for your Premier ads:
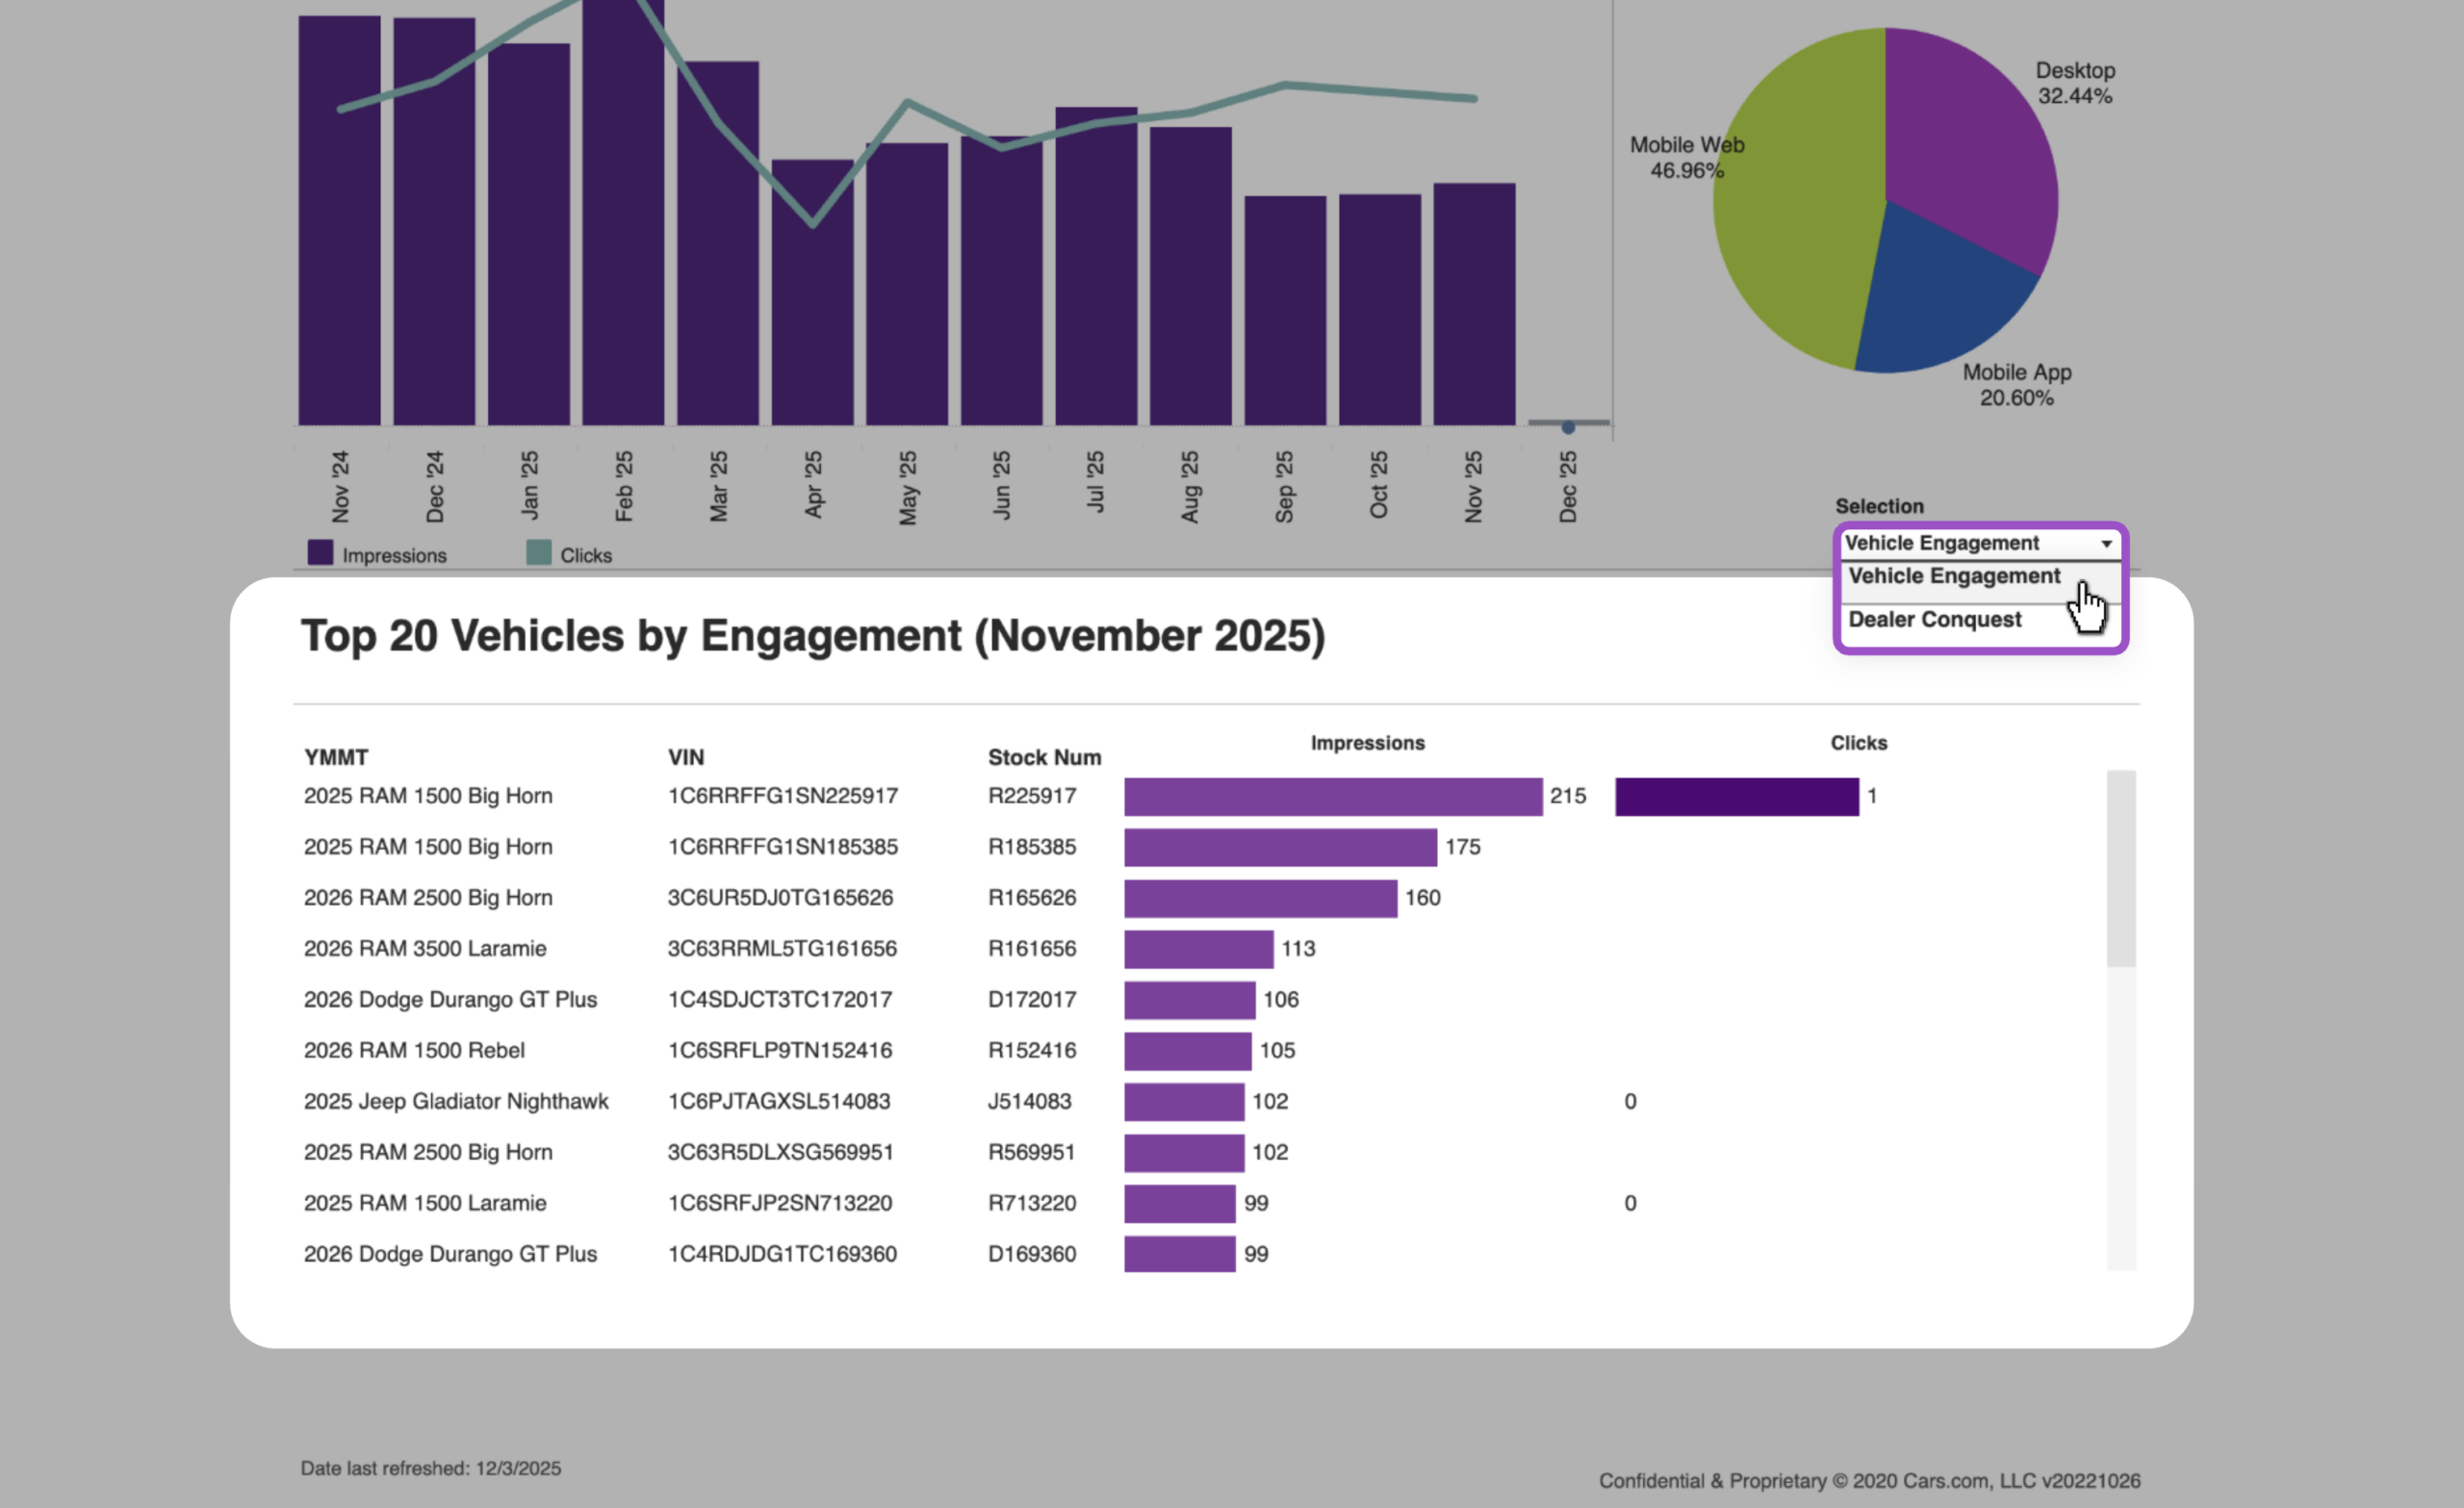
- Bar chart: Impressions and clicks over the past 13 months
- Pie chart: Distribution of impressions and clicks by platform, such as:
- Desktop
- Mobile app
- Mobile browser
- Desktop
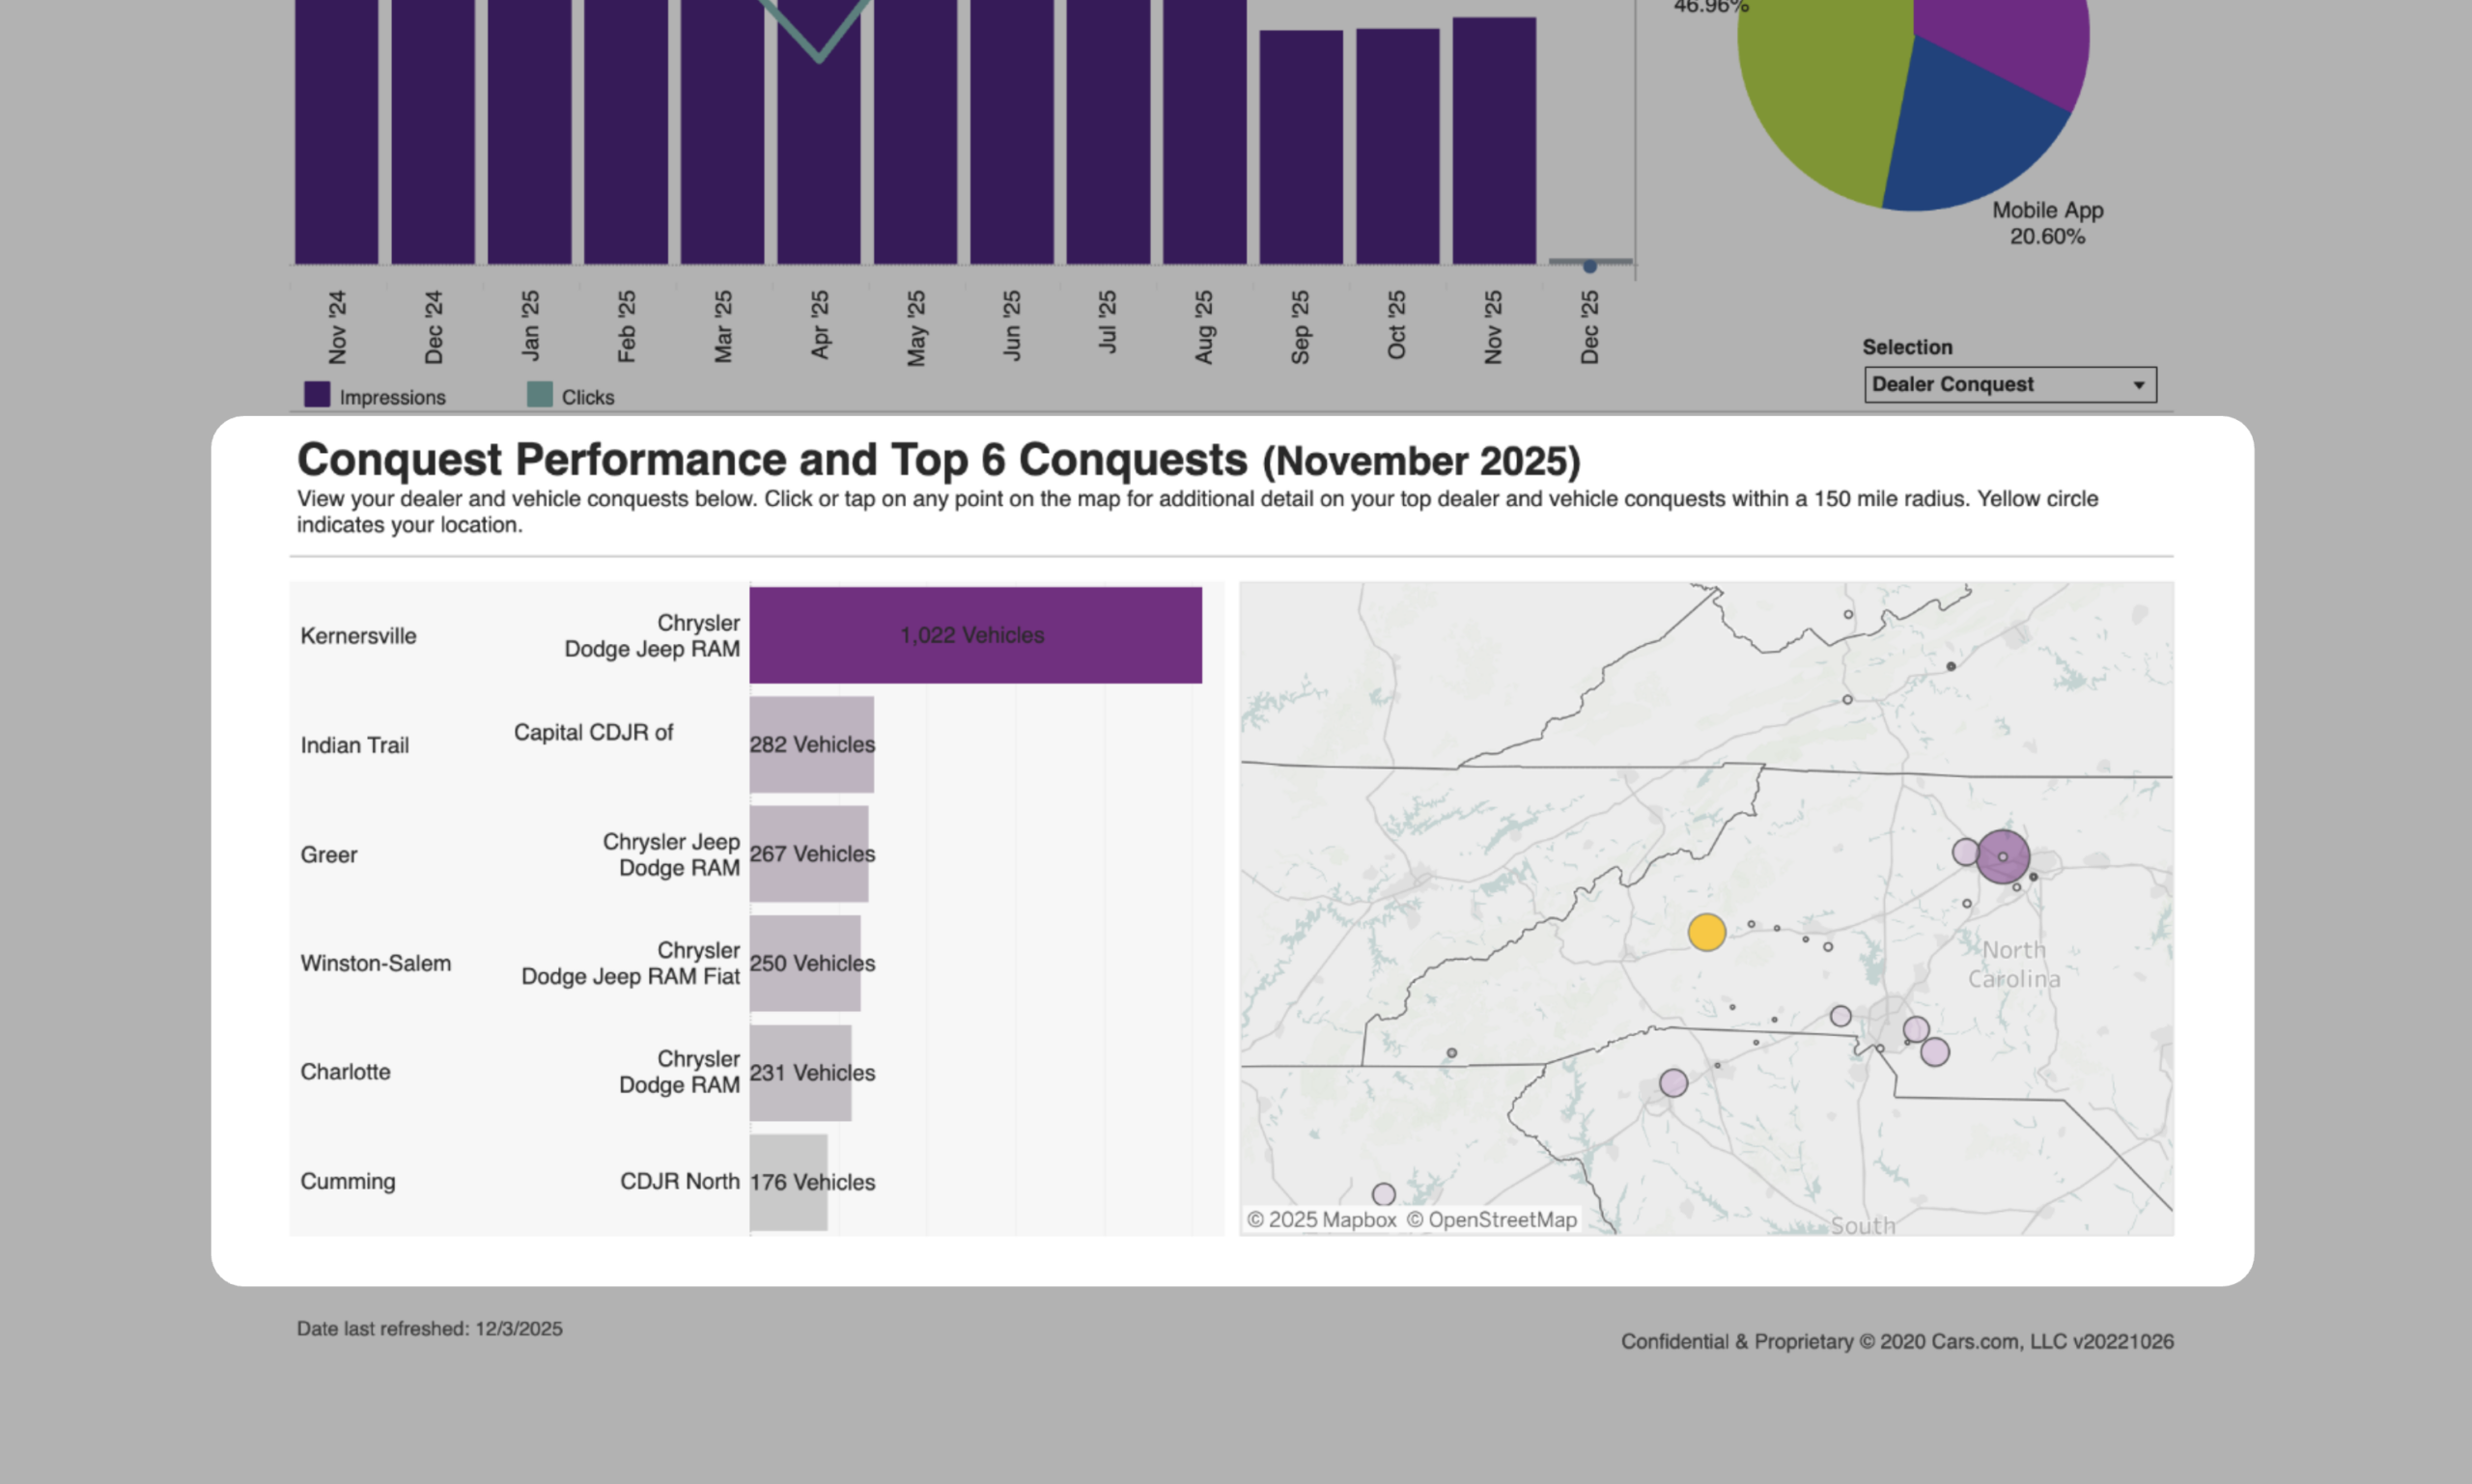
Conquest Performance and Top 6 Conquests
This section shows how your Premier ads performed against competitors within your local market.
- Data reflects competitive placement within a 150-mile radius
- Highlights the dealerships most frequently outranked by your Premier ads
Top 20 Vehicles by Engagement
Use the Selection Filter in the corner of this section and select Vehicle Engagement.
This view displays the top 20 vehicles that generated the highest shopper engagement from your Premier ads during the previous full month.
This list helps identify which vehicles are receiving the most attention through Premier placements.