How to access your DMV Market Share report
The DMV Market Share Report uses official vehicle registration data from Polk to track actual vehicle sales in your market. It provides a competitive snapshot of the top 50 dealers in your region based on market share — calculated as a dealership’s total sales divided by total market sales.
With this report, you can:
- Benchmark your store’s performance against your local market
- Spot opportunities by make, model, or segment
- Guide smarter inventory and marketing decisions
To get started
Go to the Cars.com Hub.
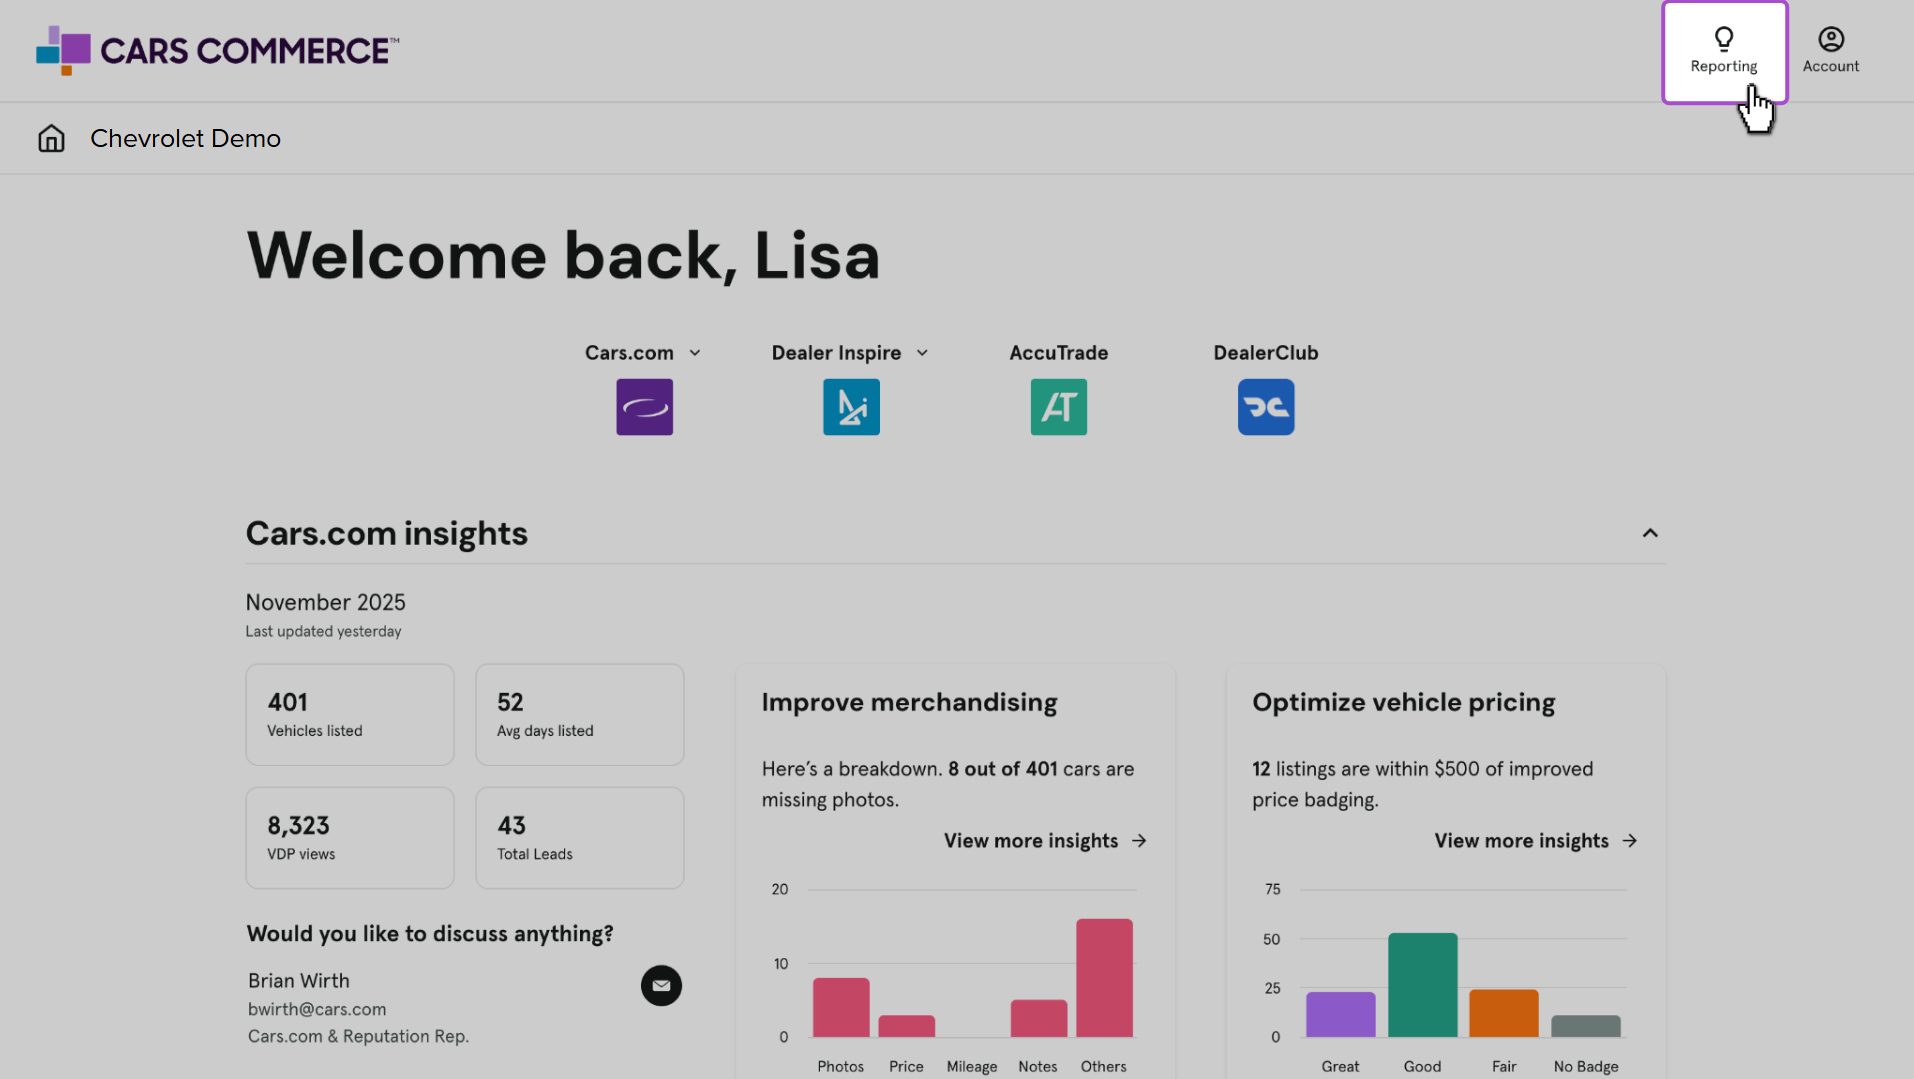
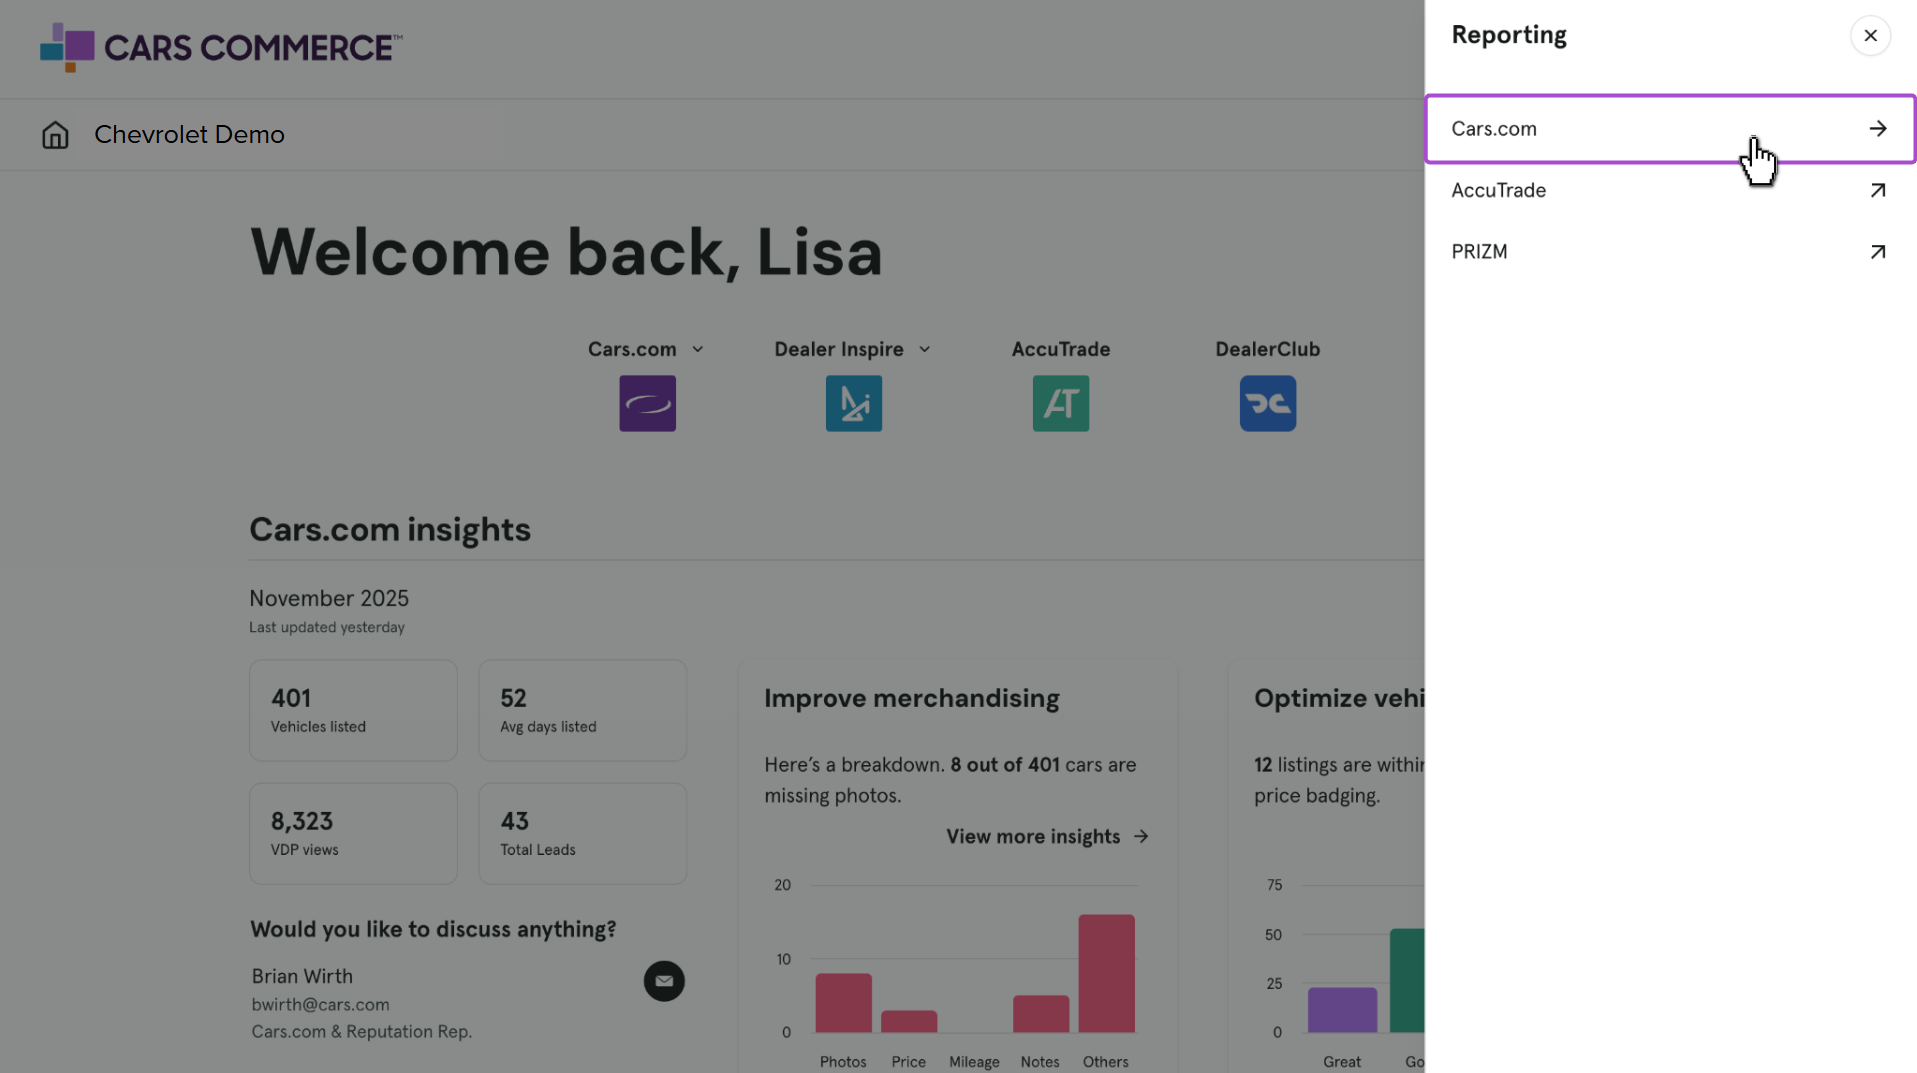
1 Find your reporting in the Hub
Once logged into the Hub, click Reporting, then Cars.com.
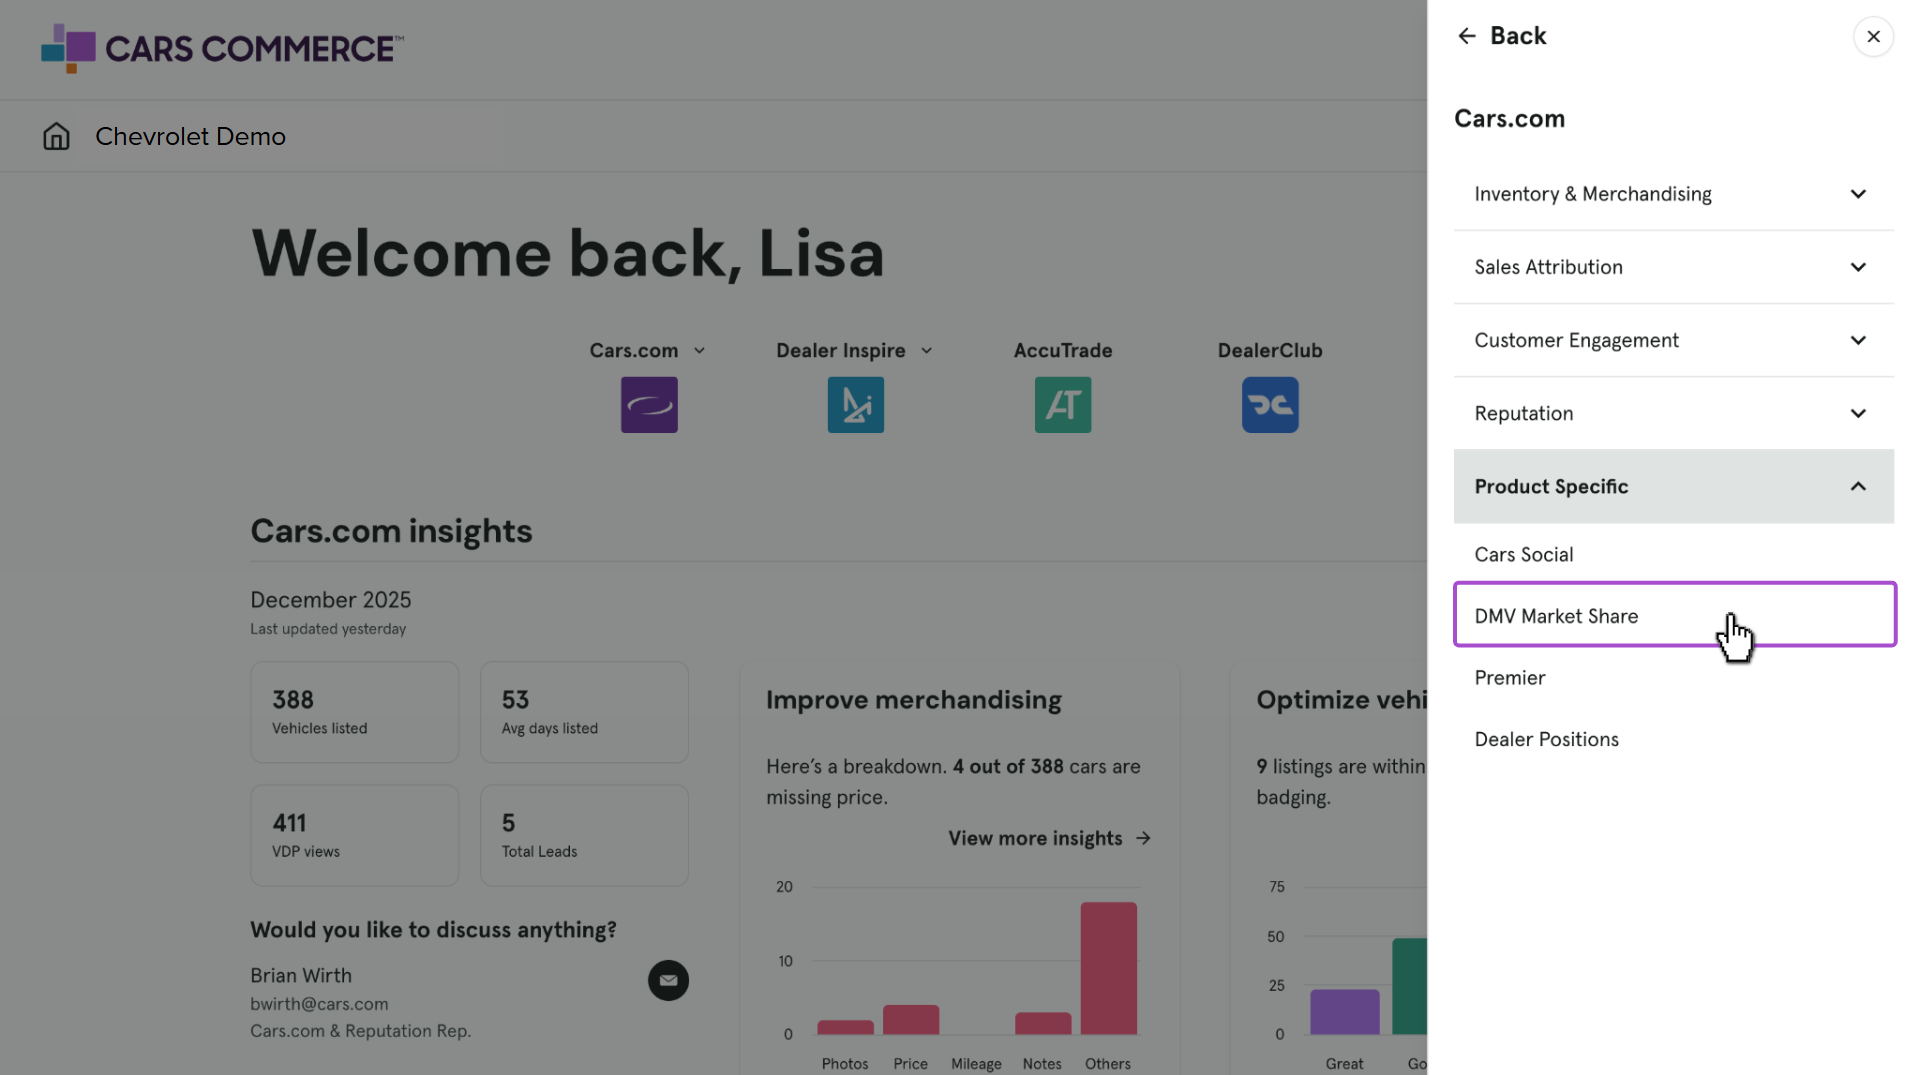
2 Select Product Specific
Click Product Specific, then the DMV Market Share report from the dropdown.
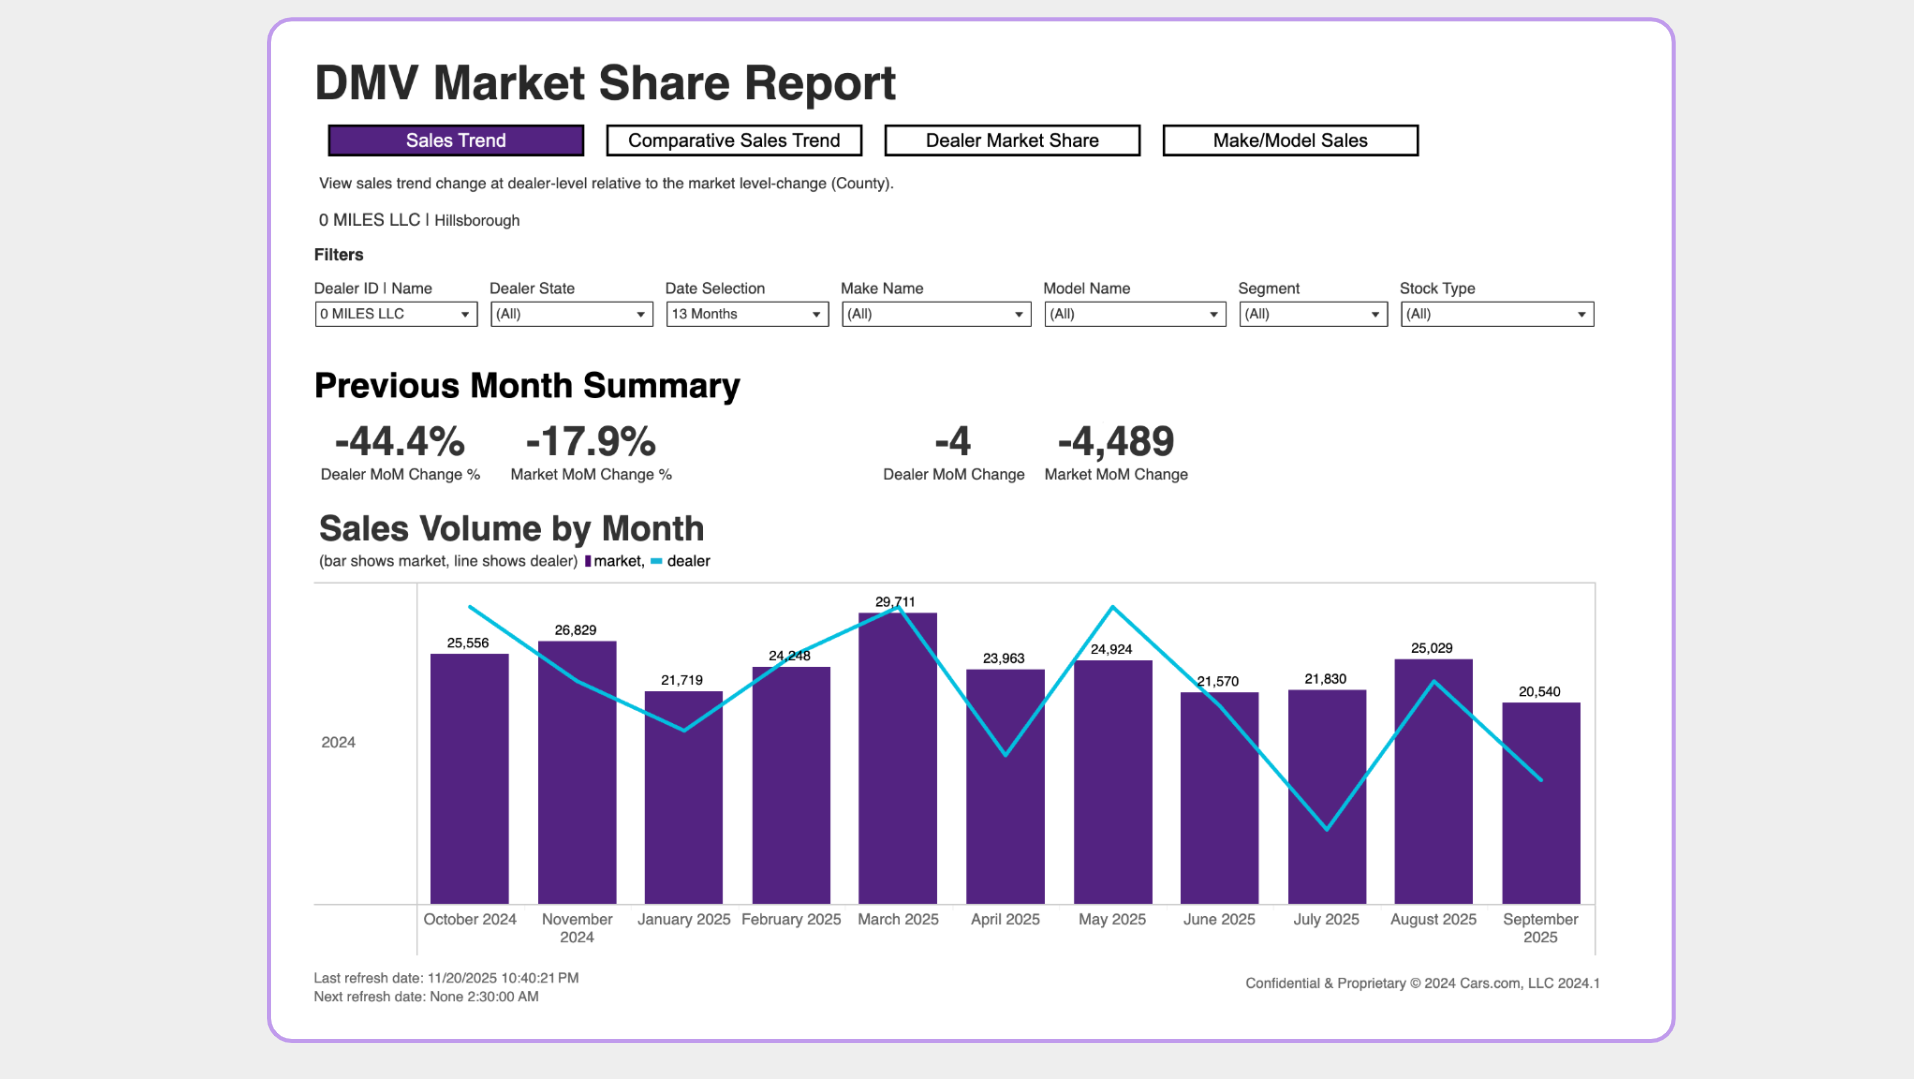
3 Using the Sales Trend tab
Apply filters to refine the report by:
- Dealer ID or Dealership Name
- State, Make, Model, Segment (vehicle category)
- Date Range and Stock Type
Previous Month Summary shows:
- Dealer Change MoM (%): Percent change in your store’s sales month-over-month
- Market Change MoM (%): Percent change in total market sales
- Dealer Change MoM (units): Actual unit change at your store
- Market Change MoM (units): Actual unit change across the market
Sales Volume by Month
- Bar Graph: Represents total market sales by county
- Line Graph: Shows your dealership’s sales
- Use filters to drill into trends by model, location, or stock type
4 Using the Comparative Sales Trend tab
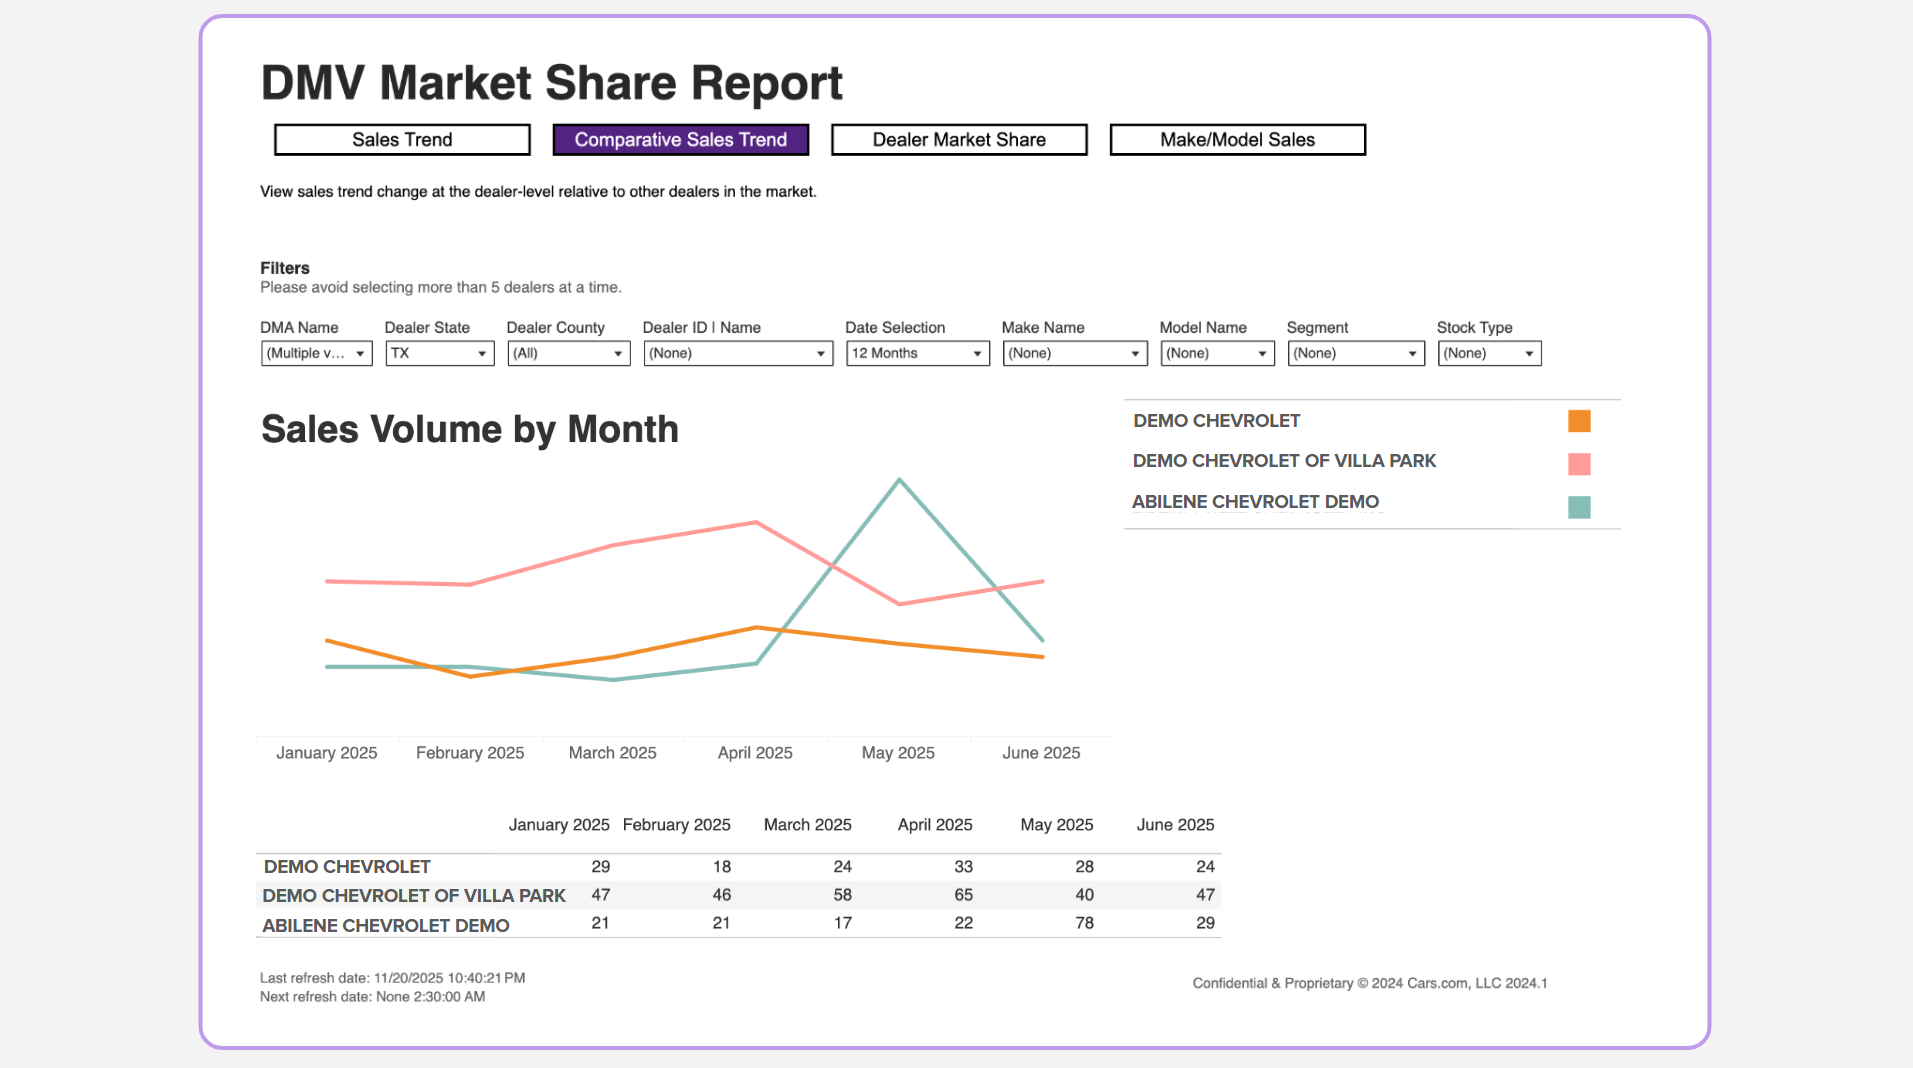
This view allows you to compare your dealership’s trends with others in your market.
Steps:
- First select your DMA Name. Relevant states and counties will auto-populate.
- Then apply additional filters (e.g., stock type, make, date range).
Chart Breakdown:
- Line chart: Sales trends for each selected dealership (color-coded)
- Table view: Total sales per dealer for the selected period
Note: Limit to 5 dealerships or fewer for clearer comparisons and faster load times.
5 Using the Dealer Market Share tab
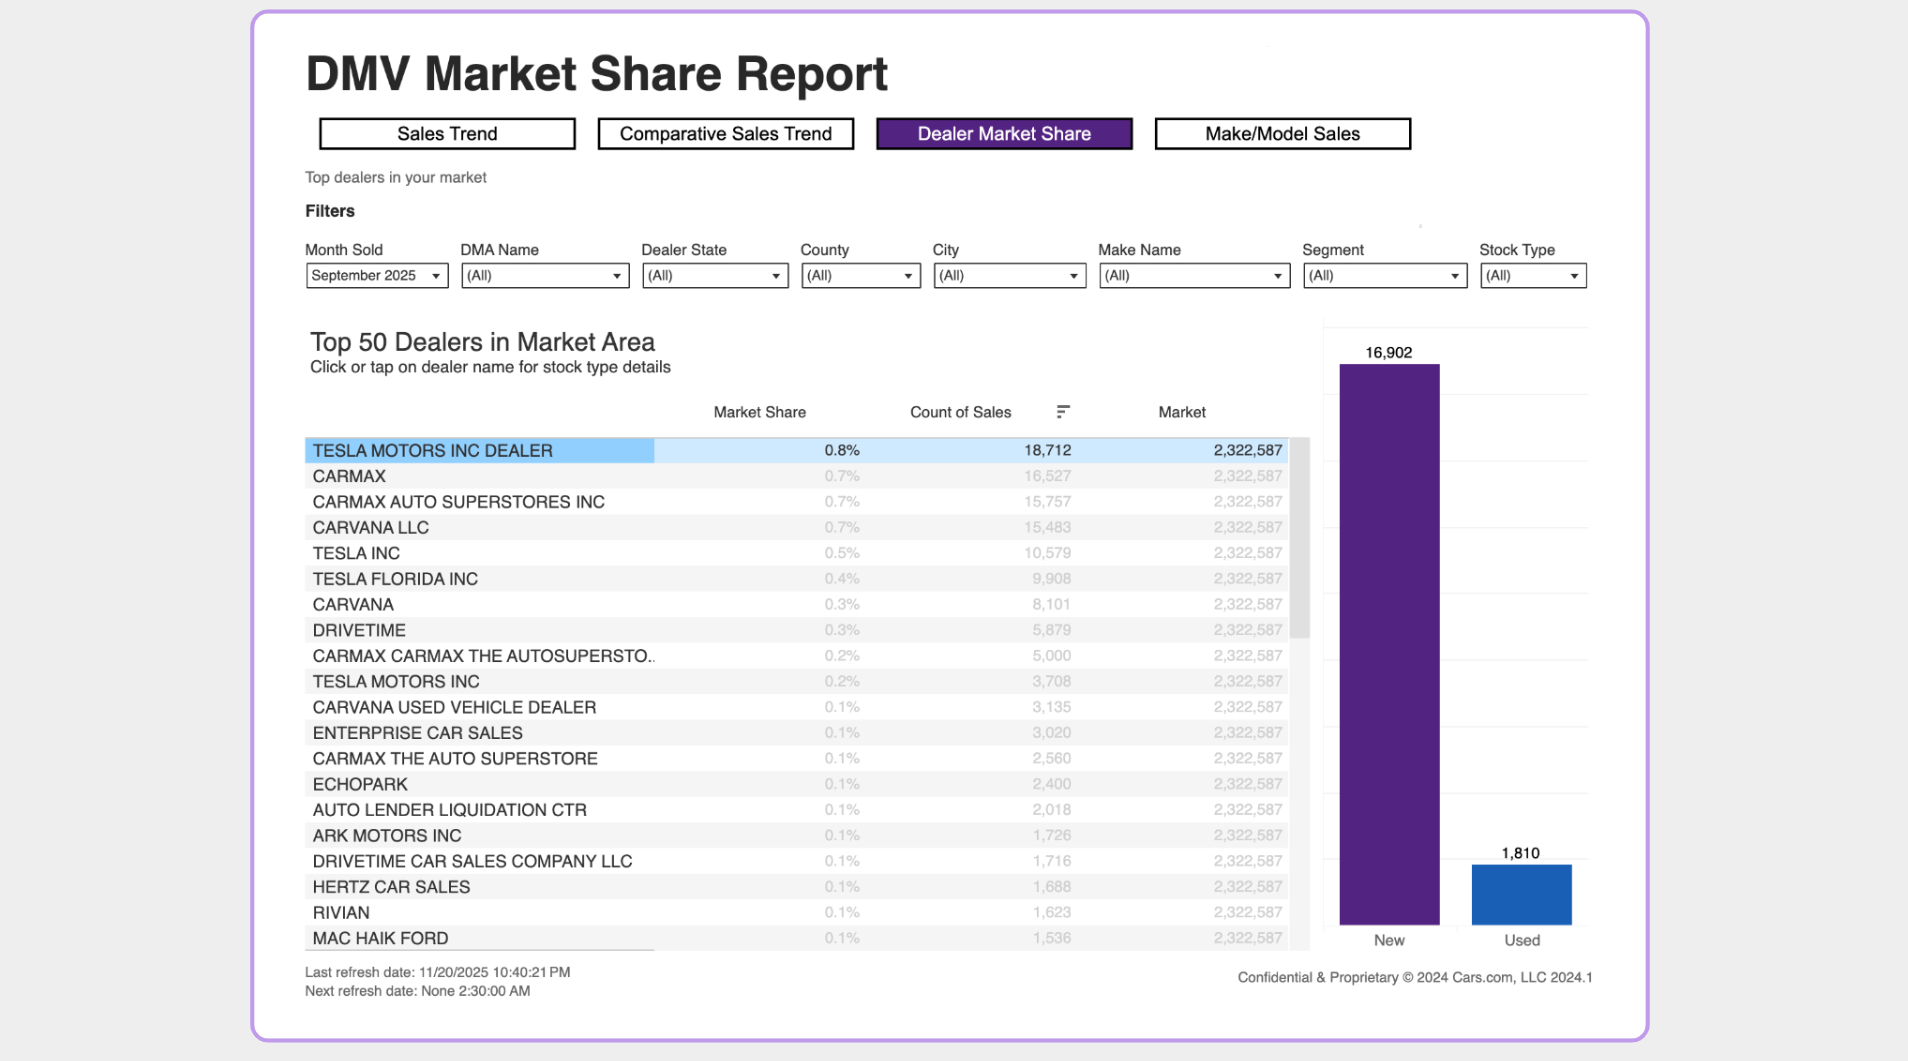
This tab displays the top 50 dealers in your DMA ranked by market share (total dealer sales ÷ total area sales).
How to use:
- Apply filters (dealer, state, stock type, date, etc.)
- Click any row in the table (highlighted in blue) to reveal a New vs. Used sales breakdown
- View the bar graph on the right for a visual comparison
This data helps identify who dominates sales in your area — and where you may gain ground.
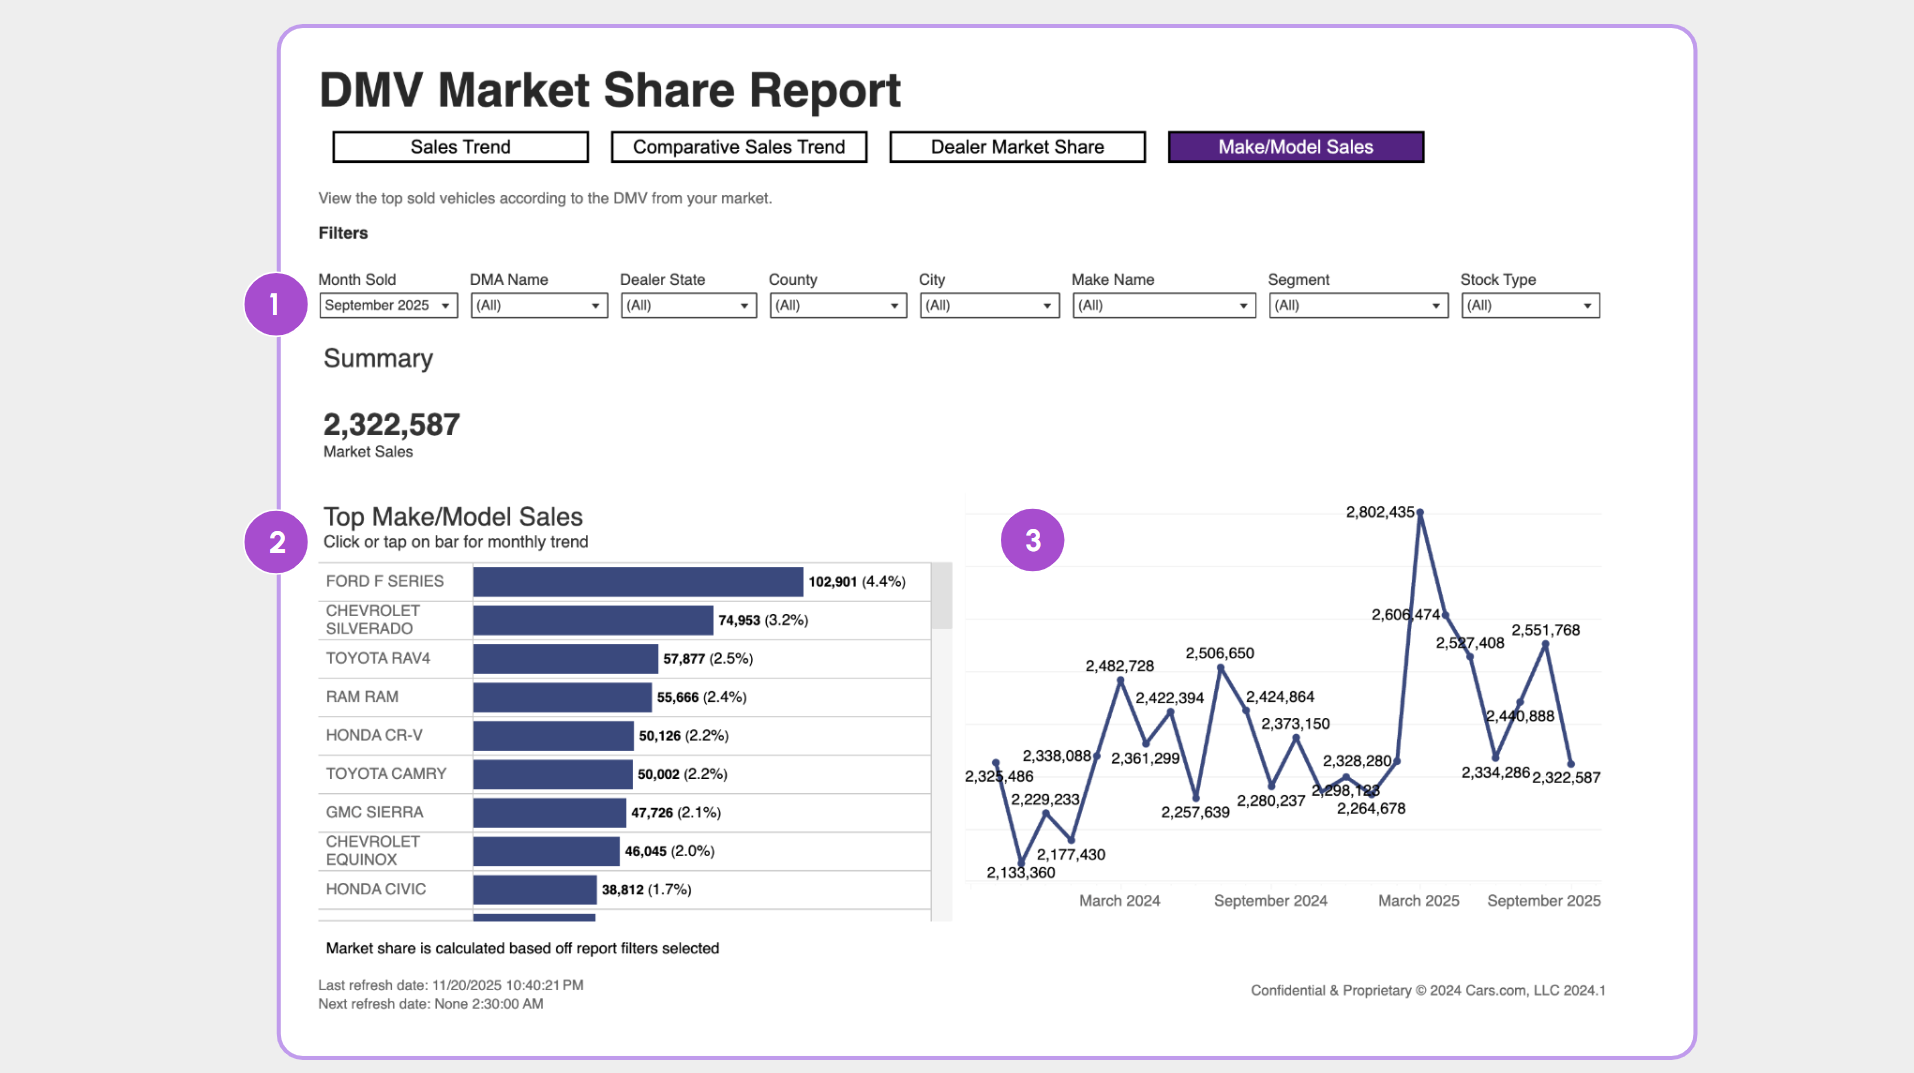
6 Using the Make/Model Sales tab
This tab reveals how different makes and models are performing in your market.
How to use:
- Filter by date, make, model, stock type, and region
- View a bar chart on the left showing total sales volume by vehicle
- View a line chart on the right showing sales trends over time for selected makes\
This data helps you assess consumer demand and popularity for specific vehicles — supporting smarter stocking and merchandising.