How to access your listings optimizer report
Understand how well your current inventory is merchandised, find areas for improvement, and see how your vehicles are performing against our “Best Match” algorithm.
To get started
Go to the Cars.com Hub.
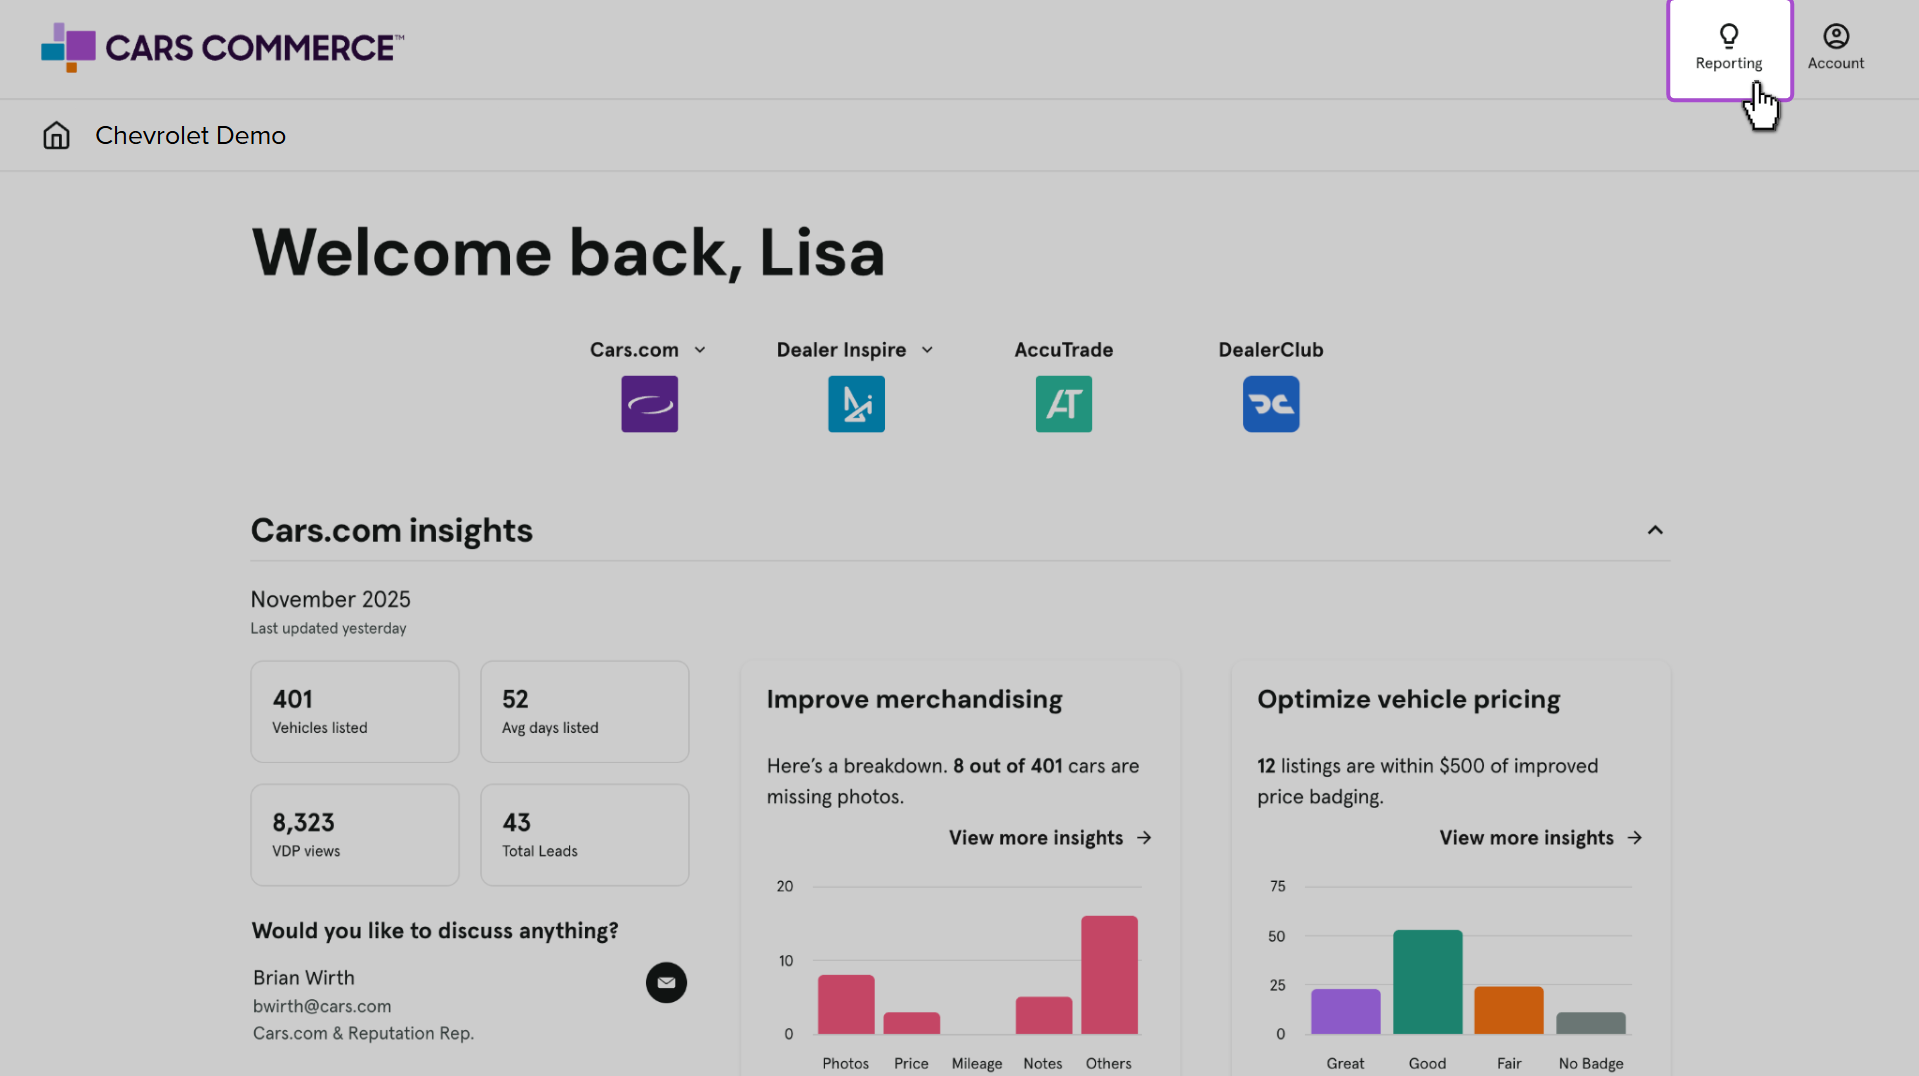
1 Find your Cars.com reporting in the Hub
Once logged into the Hub, click Reporting, then Cars.com.

2 Select Inventory & Merchandising
Click Inventory & Merchandising, then the Listings Optimizer report from the dropdown.


This report has 4 sections:
- Main Report: visuals and summary tables
- Inventory: filters and each individual vehicle’s information
- Connections: shows all connections, filtered by specific vehicle
- Best Match: shows per VIN and price to market stats
All sections of the report are available to be exported to either a PDF or an Excel document.
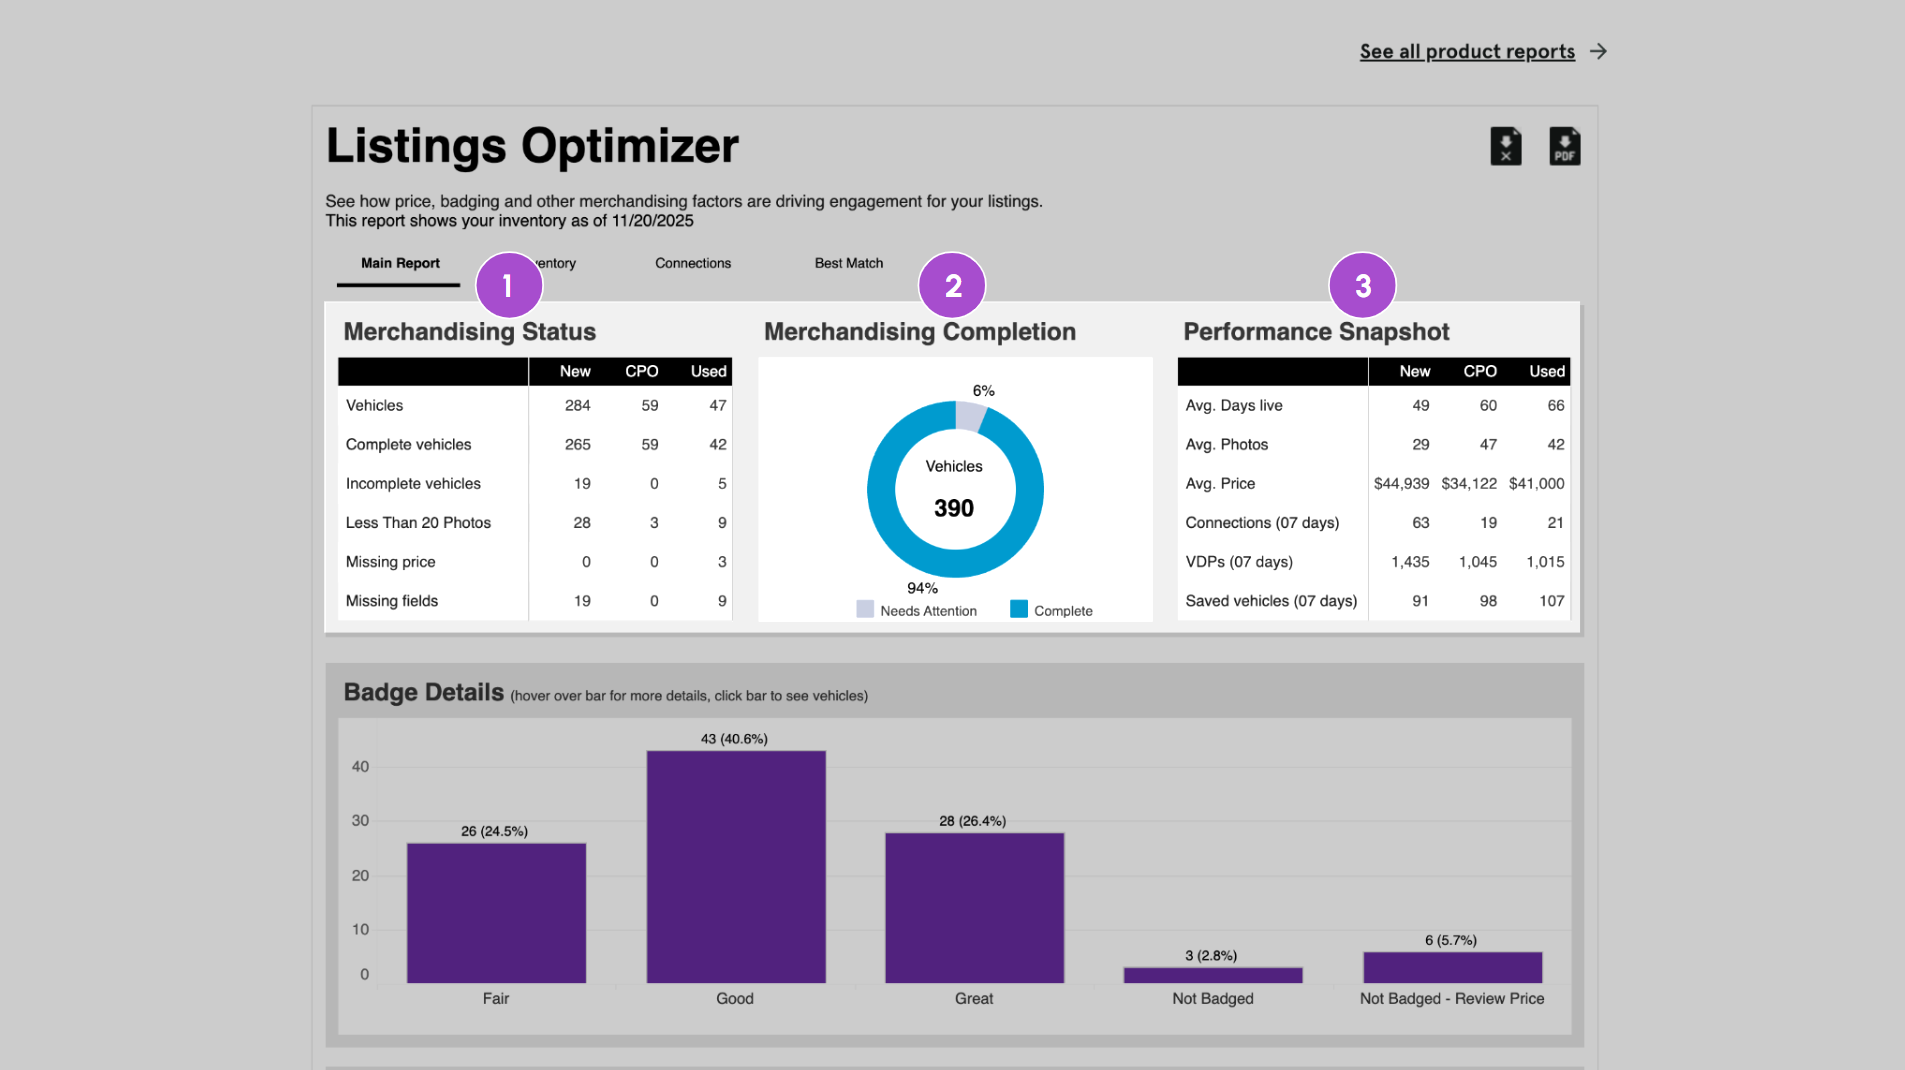
3 Leverage the “Main Report” tab
The main report is broken down into a few helpful snapshots.
- Merchandising Status
Summarizes the merchandising of your vehicles that are currently listed on Cars.com, broken down by New, Used & CPO
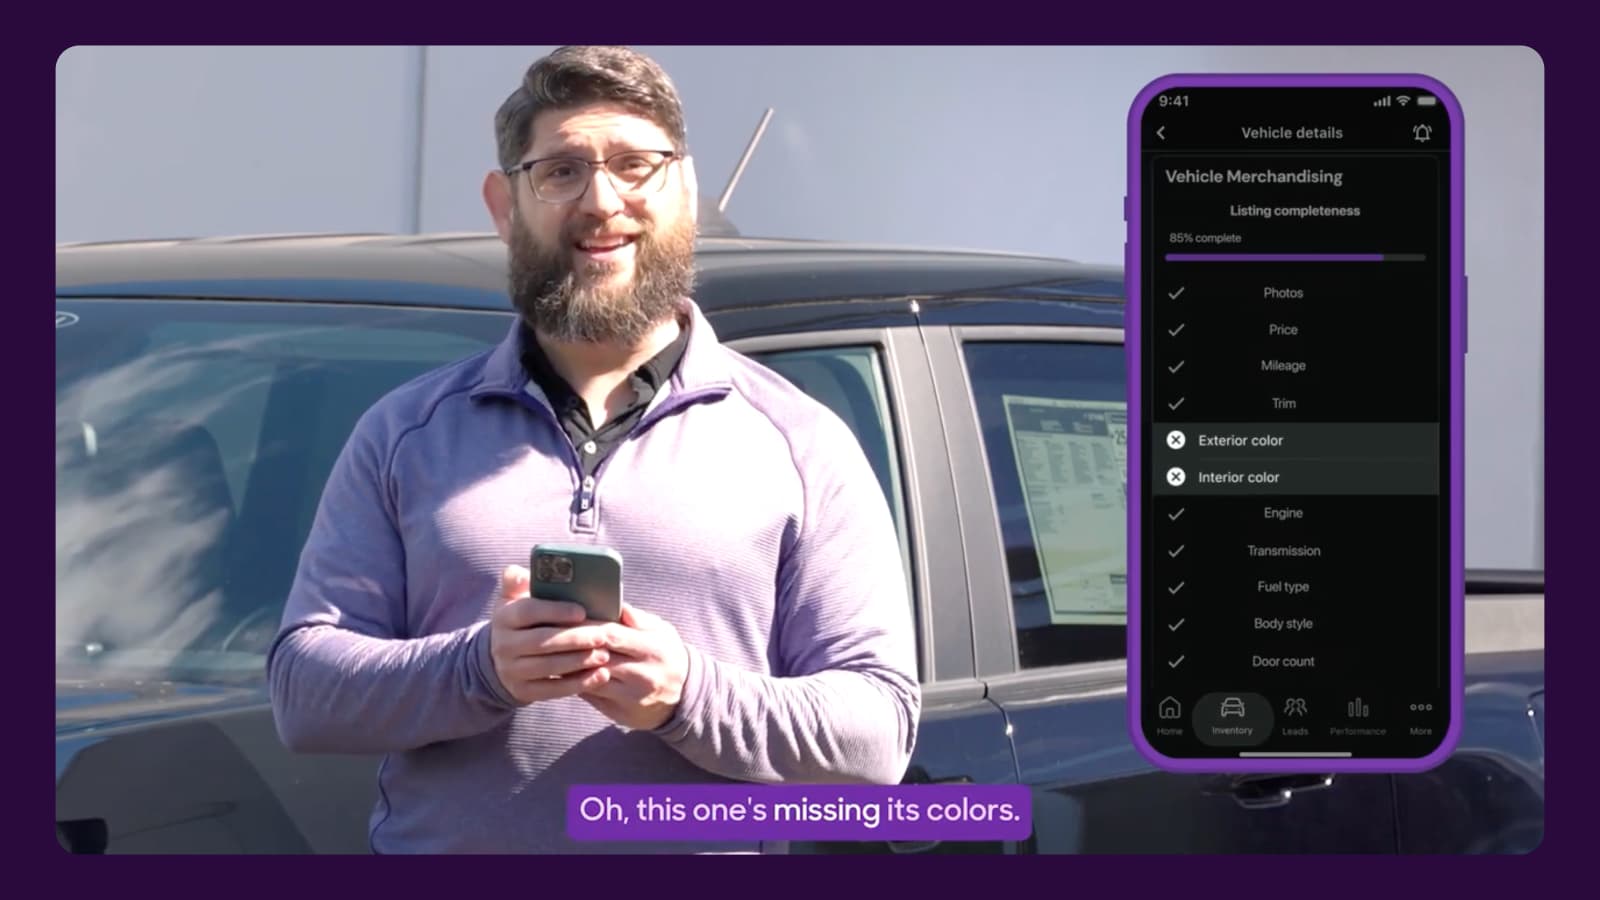
- Merchandising Completeness
Shows a visual of the % of complete vs incomplete vehicles in your inventory. Vehicle completeness considers: make, model, year, body style, door count, engine, exterior color, interior color, transmission, fuel type, price, mileage, trim, sellers notes and photos.
- Performance Snapshot
Summarizes inventory performance, broken down by New, Used & CPO
While reviewing the reports, note that they are based on the previous day’s inventory data and will not reflect same-day changes.
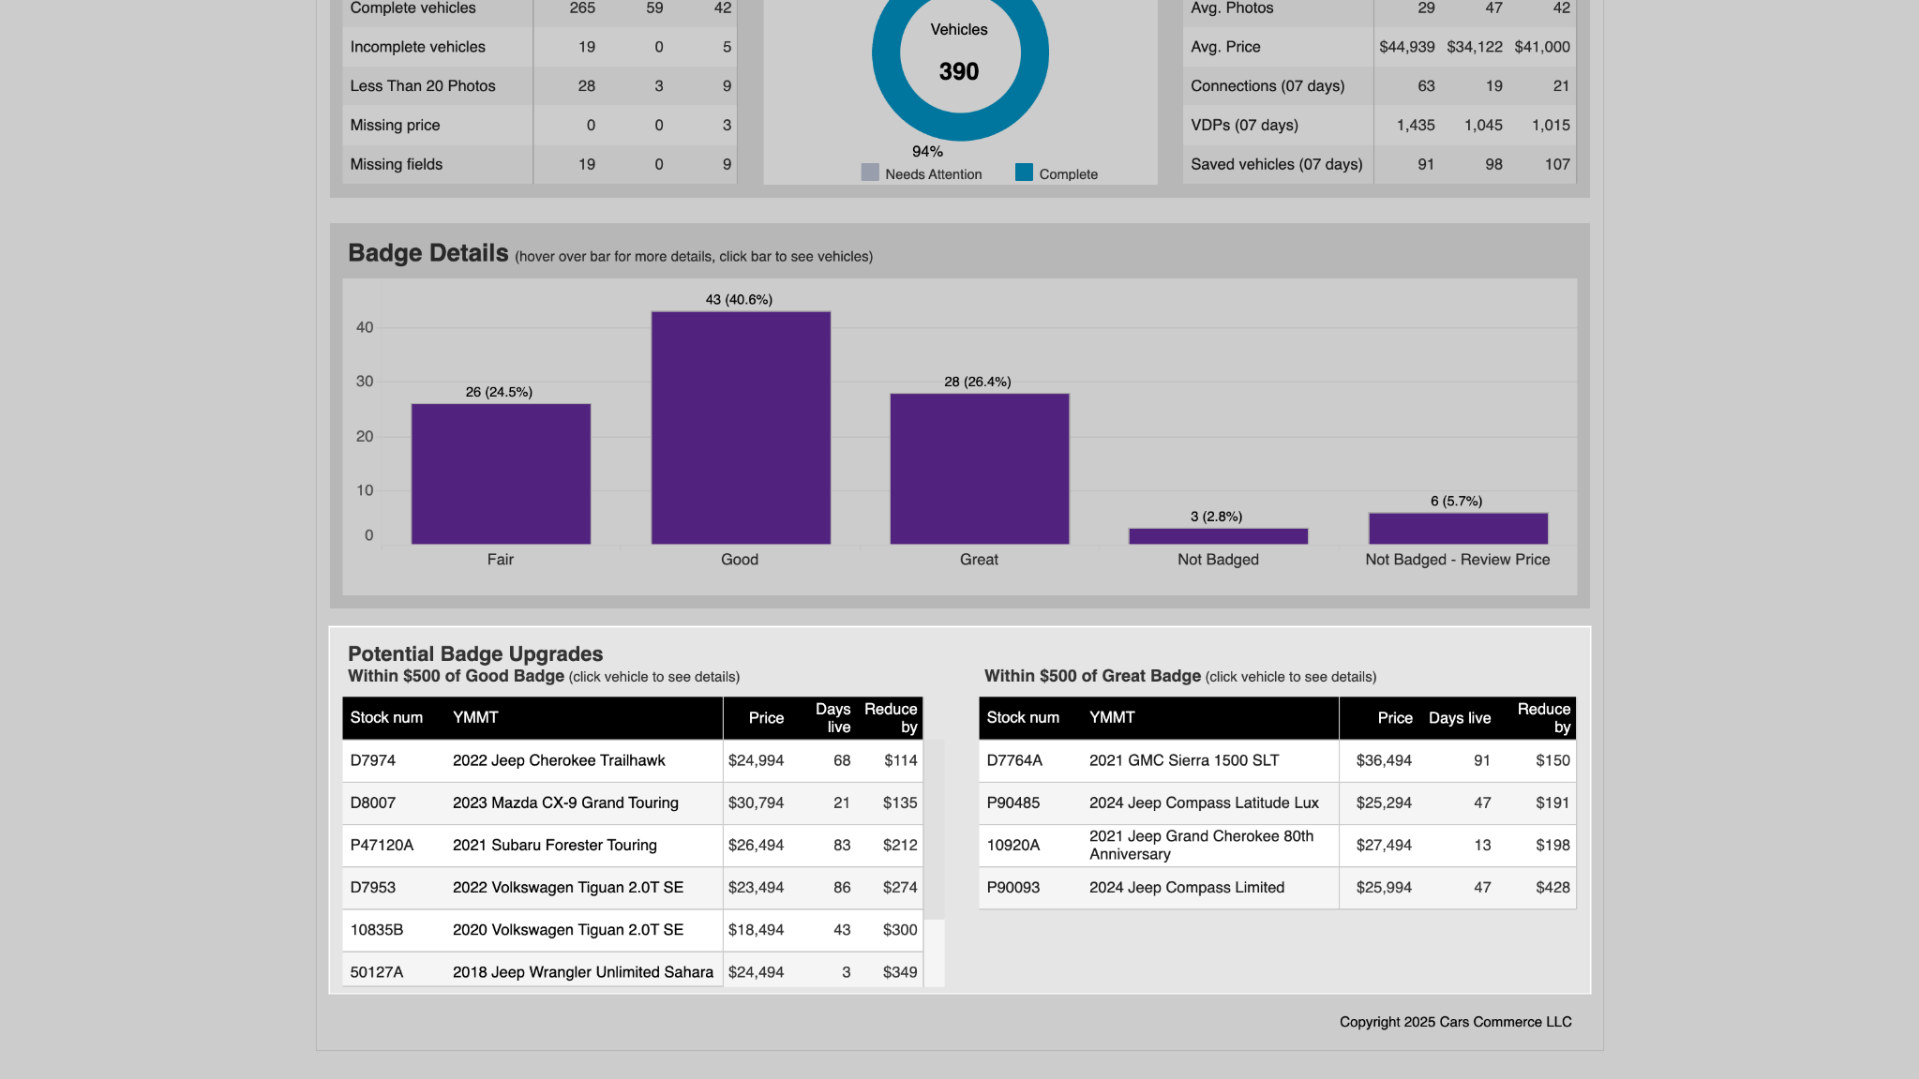
4. Badge Details (used only)
This area focuses on price badging at a high level, showing which vehicles are great, good, fair, above market average, below market average, or not badged. If a vehicle is labeled as unknown, it might be because it does not have a price or the vehicle is unique and there are not enough vehicles in the local market to compare.
Hover over the bar graph to see average VDPs and connections per VIN for each group of badged vehicles.

5. Potential Badge Upgrades
This section lists vehicles that are less than a $500 price drop away from the next badge up (Good or Great). If you click on a specific vehicle, it will drill down and take you to the vehicle details for that car to learn more about it.
Keep in mind that this data is one day behind, so price badge adjustments may not be up to the minute accurate based on what other changes happened in the market that day.
4Review the “Inventory” tab
The Inventory tab is a detailed, filterable list of every live vehicle you currently have listed on Cars.com. Unlike the Main Report summary, this section provides a granular view of each individual VIN. This is where you can learn how to best take action on specific listings. Identify exactly which cars are missing photos, which are eligible for a price badge upgrade, and which are generating the most (or least) shopper engagement. It bridges the gap between high-level data and your day-to-day inventory management.
The Inventory section will default to showing all live inventory, but you can utilize the filters to really drill down the specific aspects of merchandising you want to hone in on. View data that is most important to you, like Stock Type, Price Badge, days live, leads, and so on.
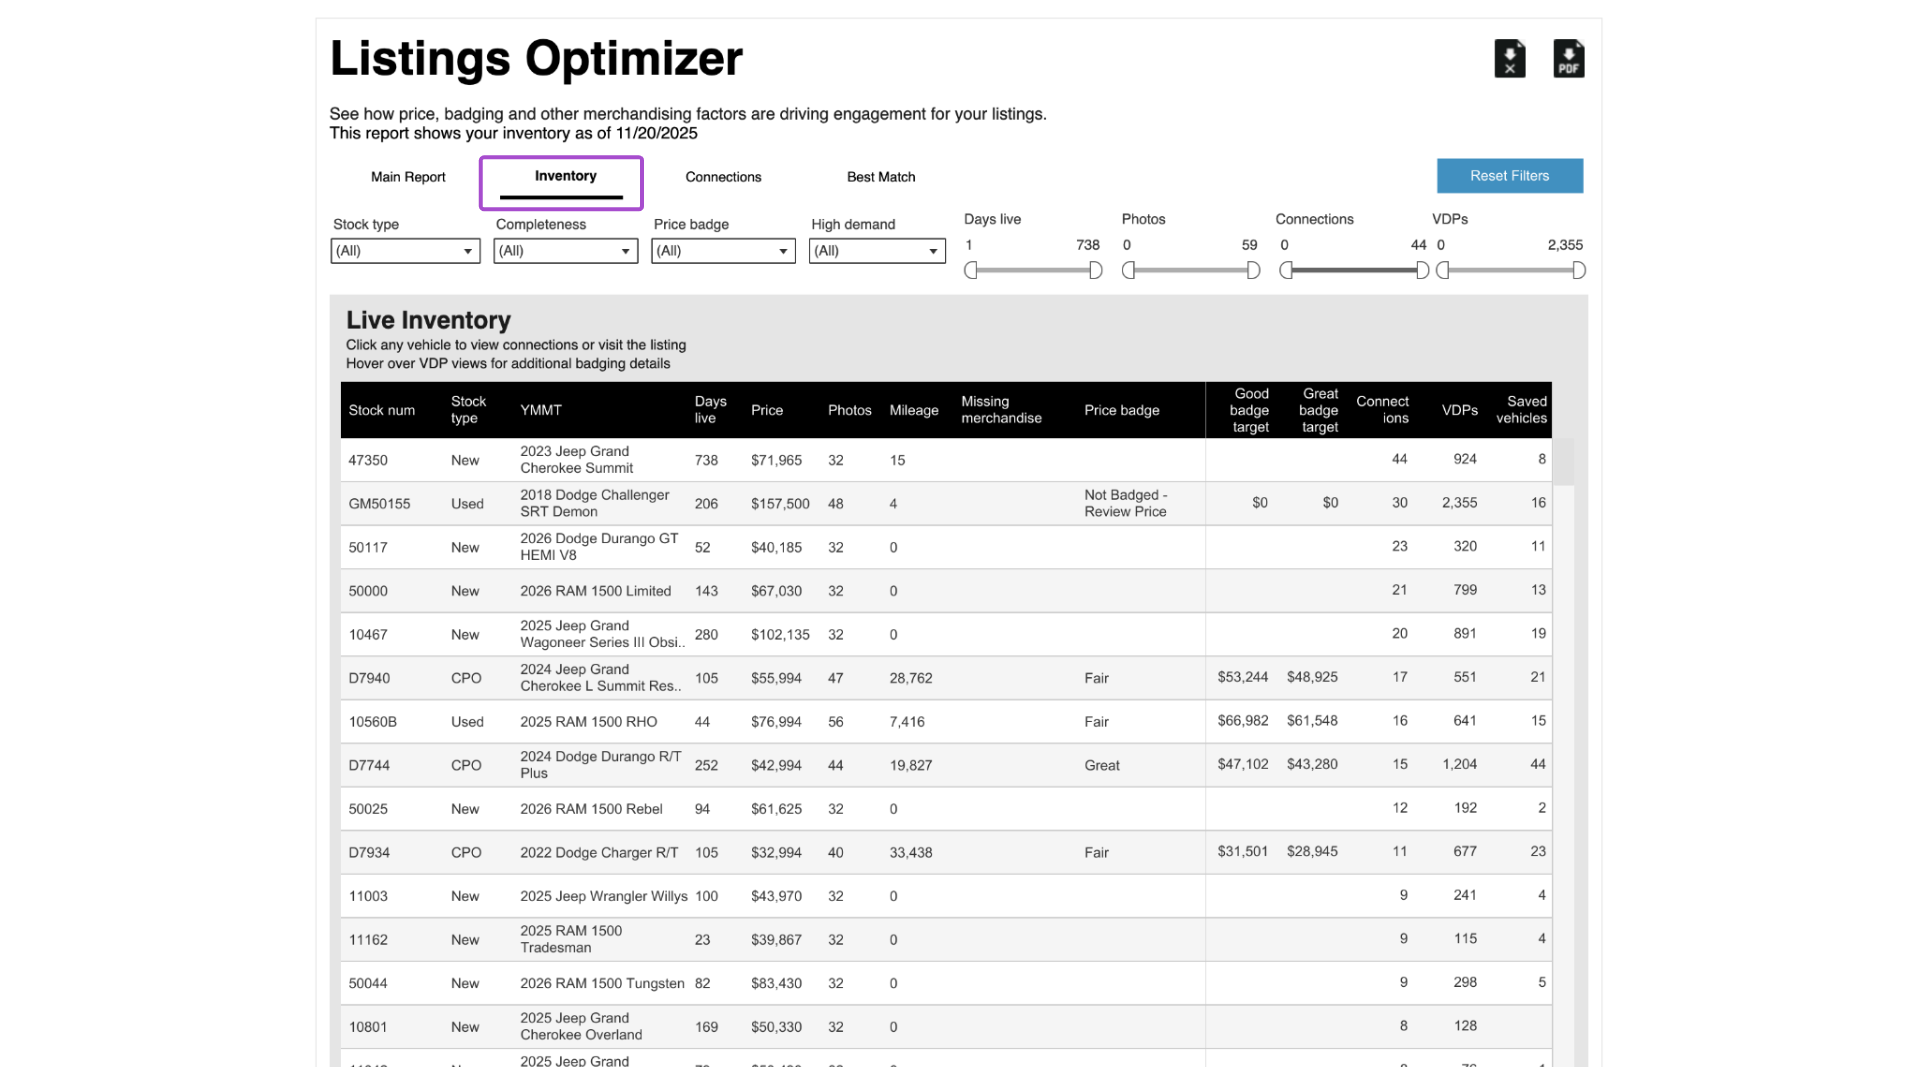
Hover over metrics on the right side of the chart to see additional price badging details.

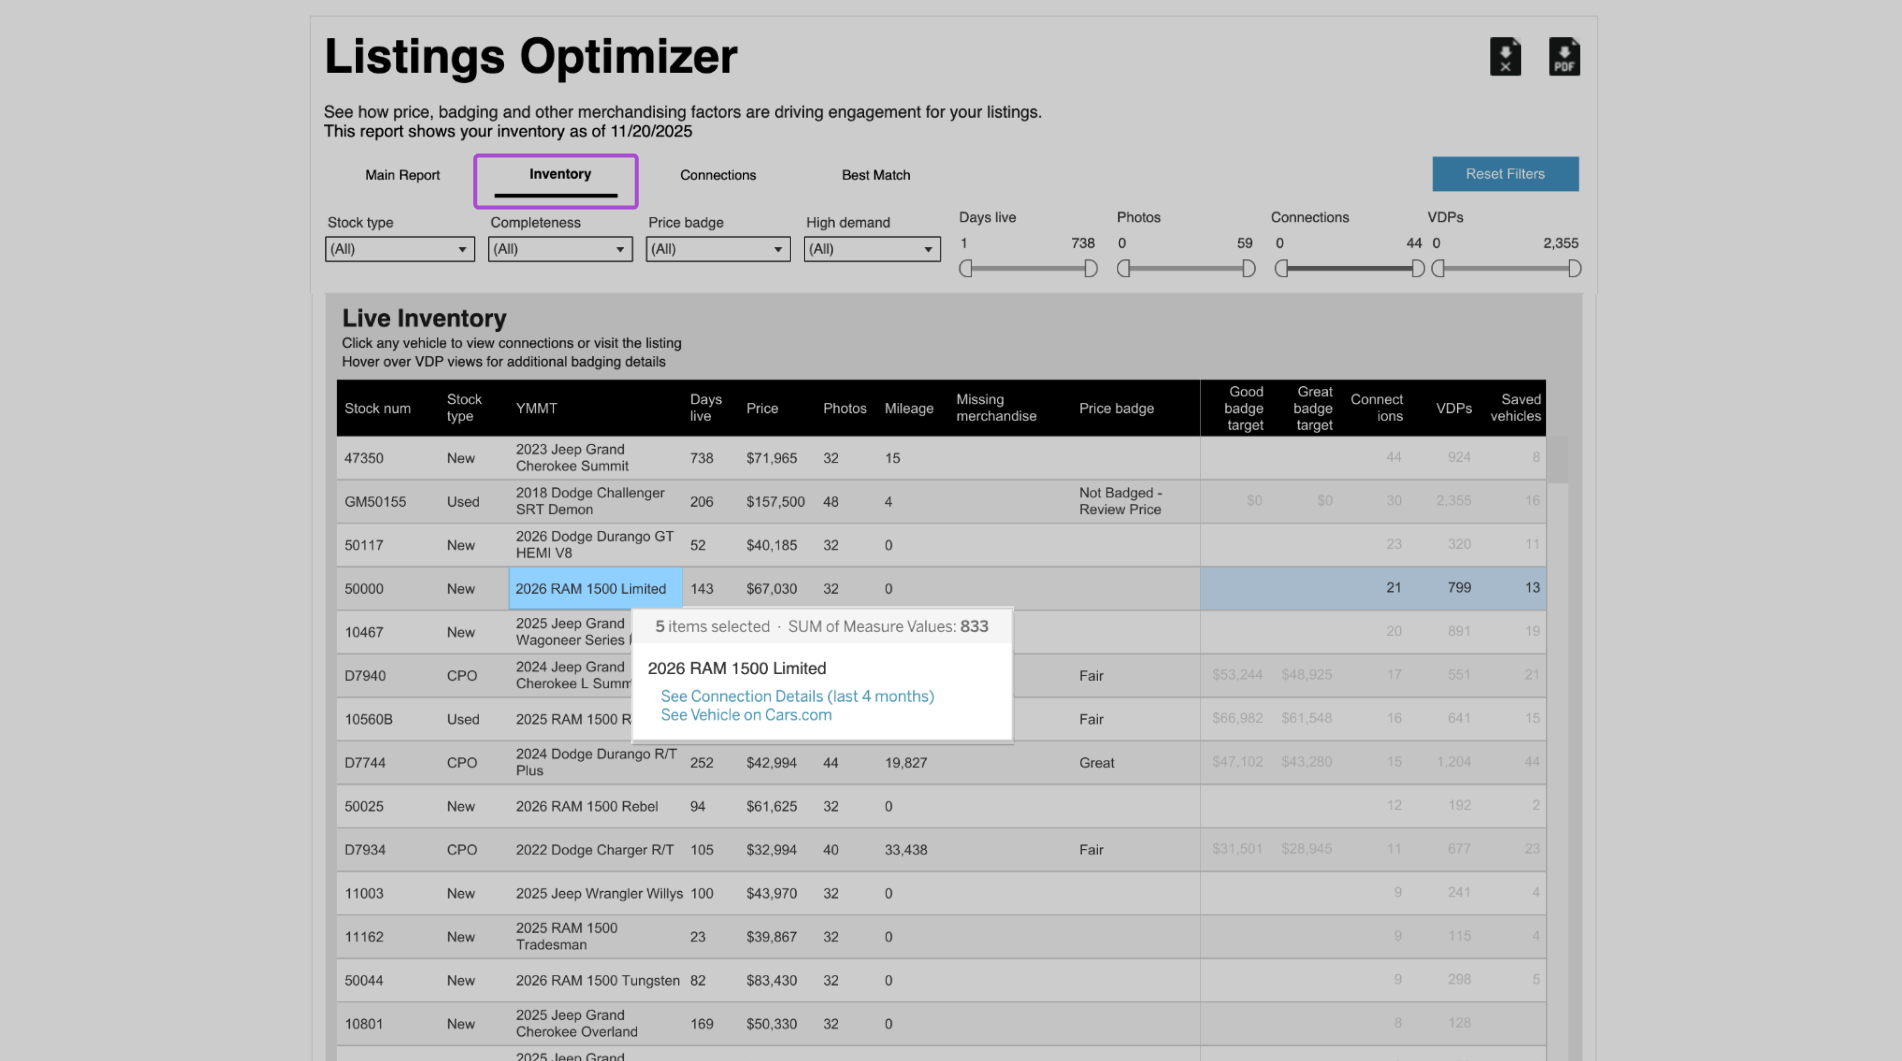
Click on a specific vehicle to see its VDP live on Cars.com or see the connections that came in on the vehicle in the last 4 months.
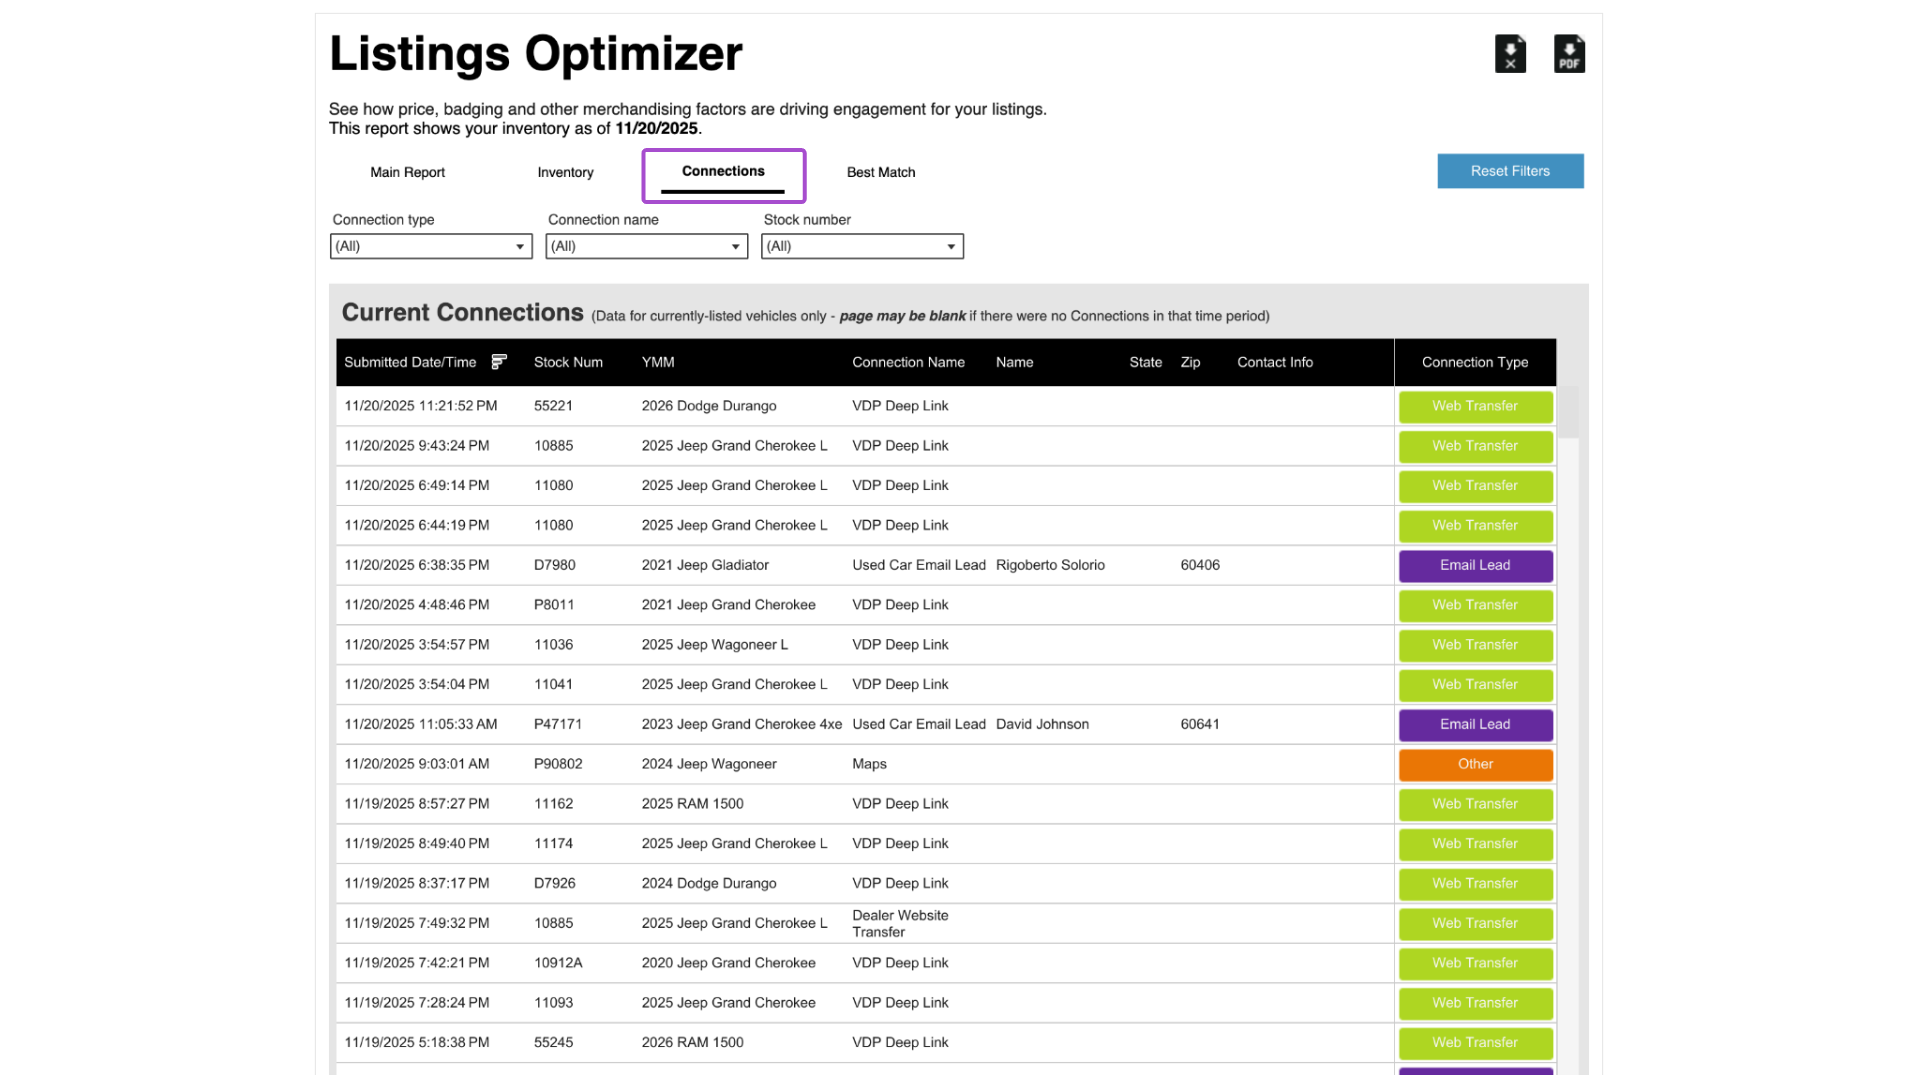
5 Review the “Connections” tab
The Connections tab is a centralized log of all consumer-driven actions, such as leads, calls, and chats, generated by your live inventory. This tab helps you measure the tangible ROI of your listings. By tracking which specific vehicles are driving high-intent shopper behavior, you can better understand which merchandising strategies are successfully converting views into actual customer inquiries.
Select the Connections tab at the top of the page to see all connections on currently live inventory for the last 4 months.
Filter by Connection Type, Connection Name, or by the Stock Number of a specific vehicle.
6 Click into the “Best Match” tab
The Best Match tab provides insights into the various data points and “drivers” that influence where your vehicles appear in Cars.com consumer search results. Cars.com uses a “Best Match” algorithm to show the most relevant cars to shoppers. This tab allows you to see how your inventory stacks up against the algorithm’s criteria, such as photo count and pricing, so you can optimize your listings to rank higher in search results.
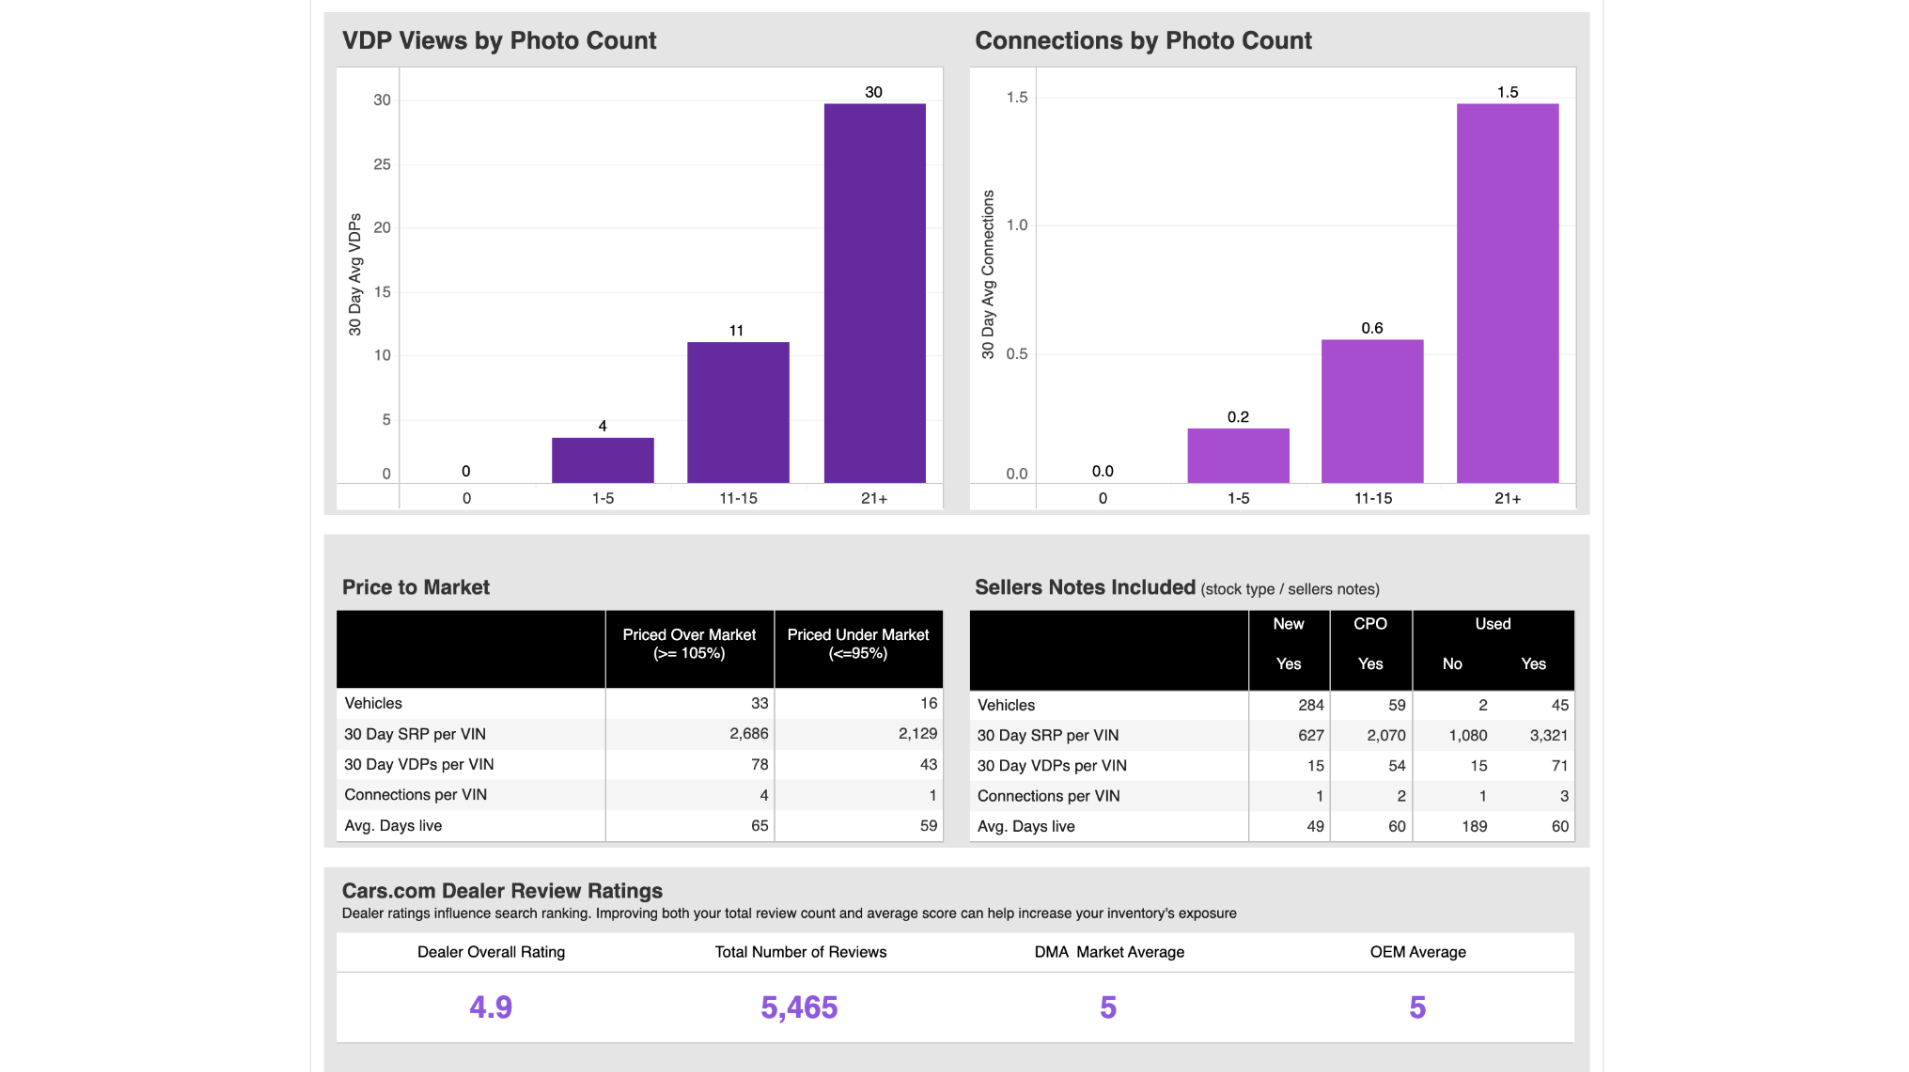
Select the Best Match tab at the top of the page. This section of the report shows what drivers may be affecting a dealer’s Best Match performance results on consumer searches and can be filtered down by Stock Type.
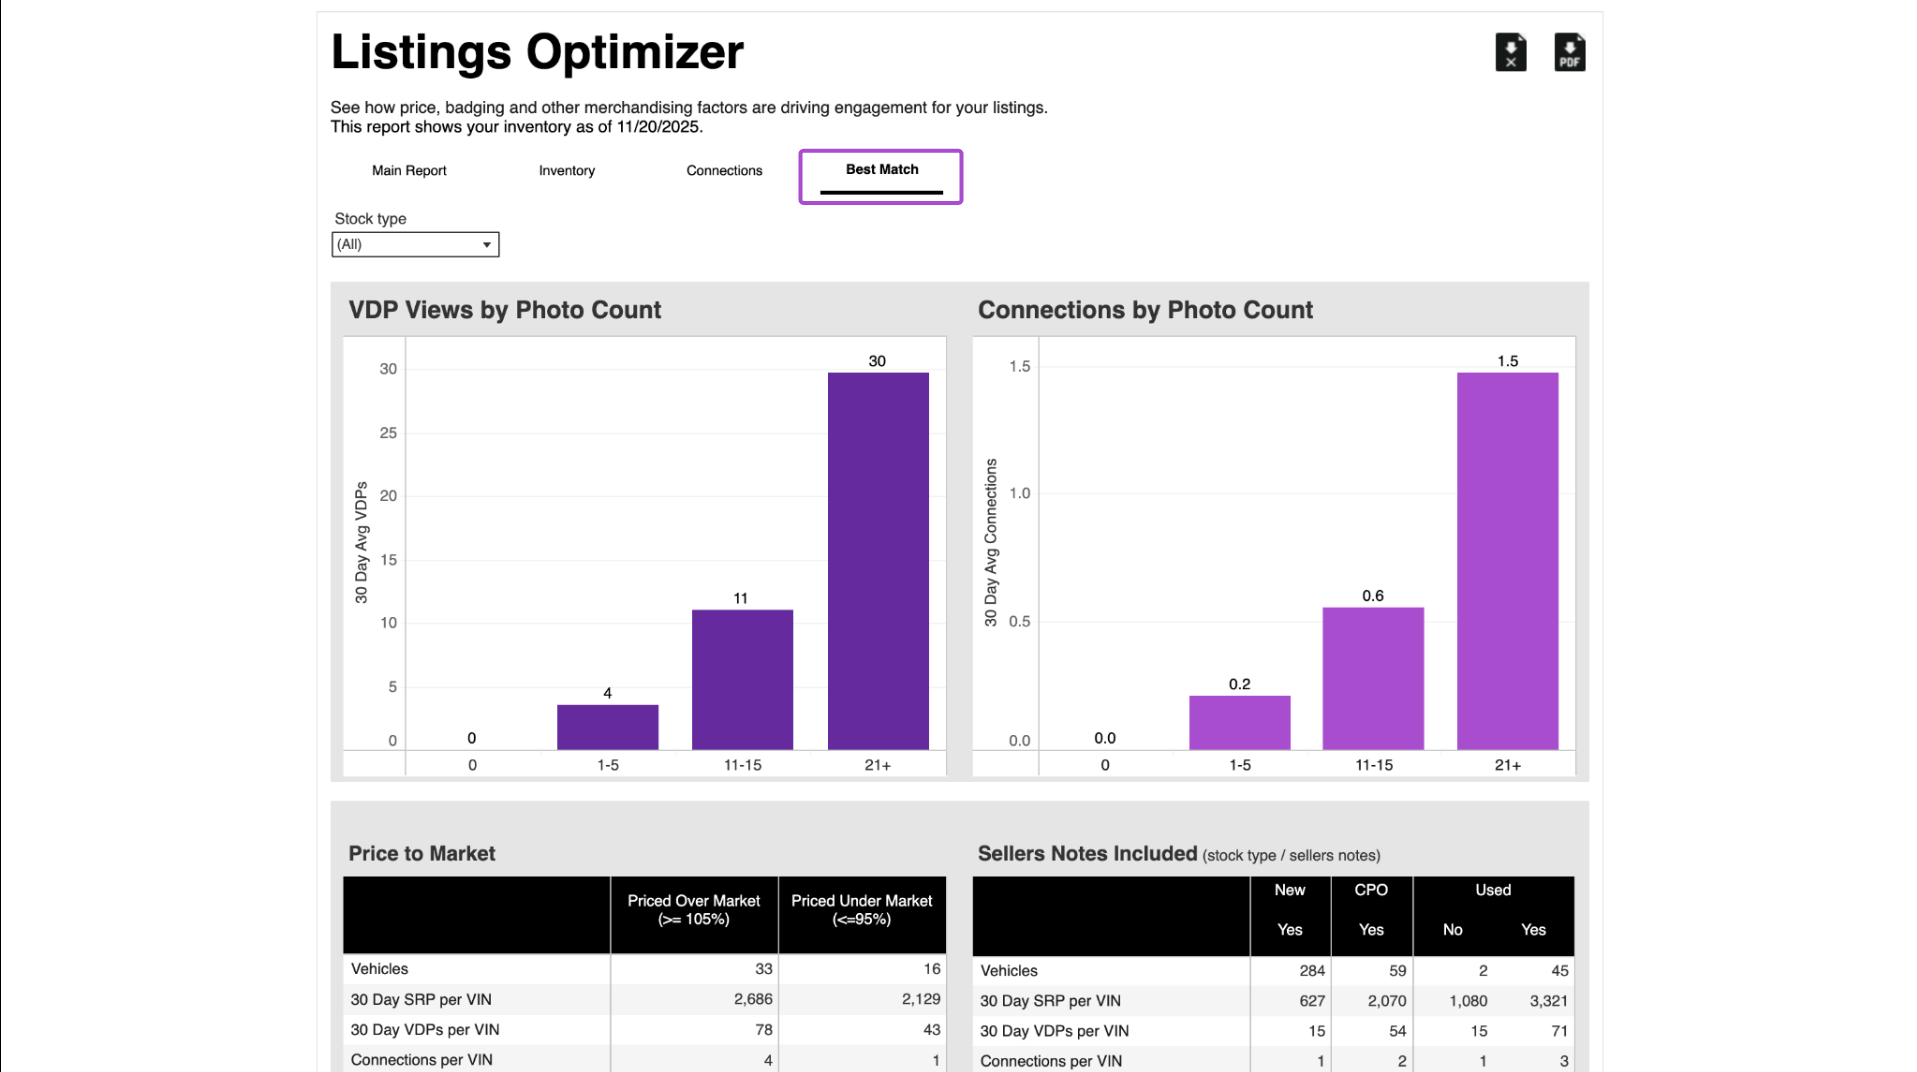
You’ll see the number of photos correlated to the number of VDPs and Connections per VIN, Sellers Notes, and Price to Market stats. It includes a snapshot of your current Review ratings.
Need more information?
Your Cars Commerce Account Executive can answer your reporting questions. You can also contact support at 888.252.7731 or support@cars.com.