How to access your Demand Signals report
The Demand Signals report gives you real-time insight into which makes and models are most in demand within your DMA. It compares your current inventory performance against actual market activity and provides a price-to-market comparison for your listings.
Use this report to:
- Identify your fastest-moving units (Churners and Rarities)
- Spot Lot Sitters that may need pricing or wholesale adjustments
- Compare your pricing strategy against the local market
Inform smarter acquisition and inventory decisions
To get started
Go to the Cars.com Hub.
1 Find your reporting in the Hub
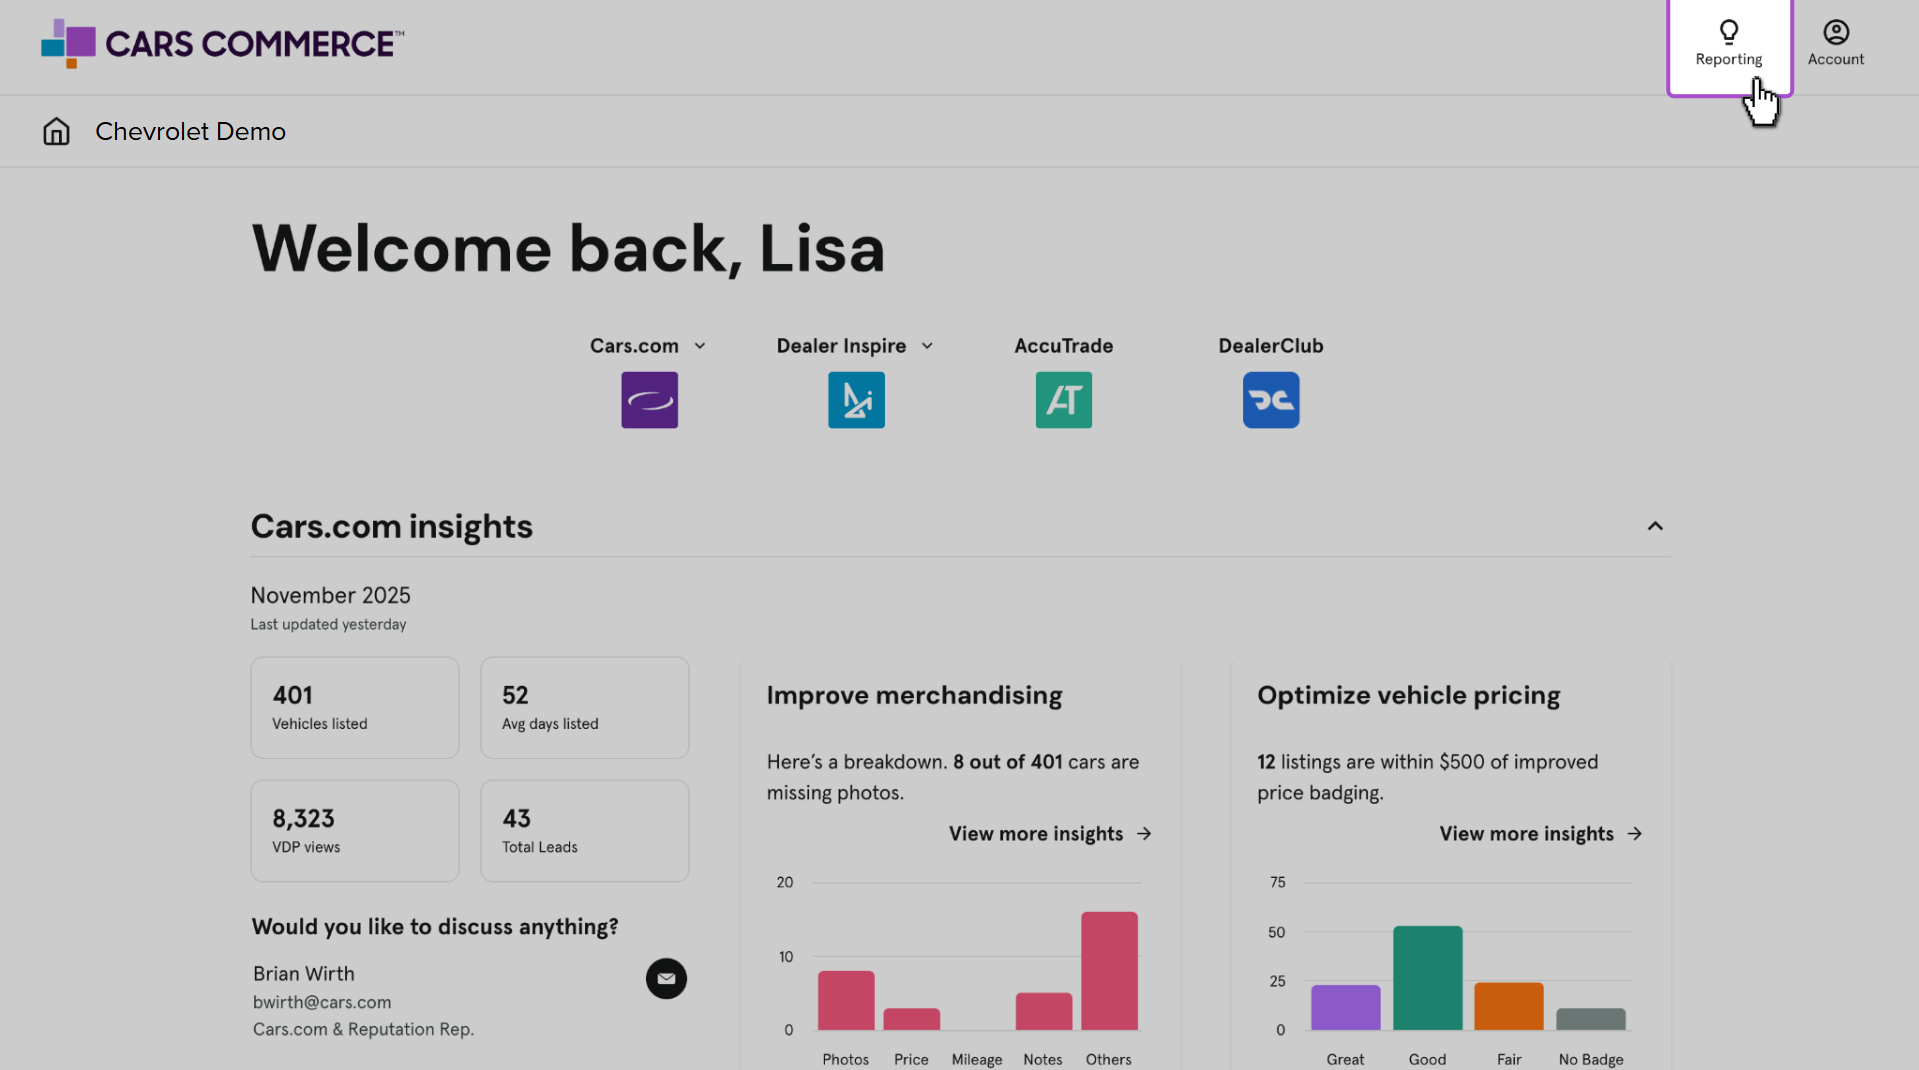
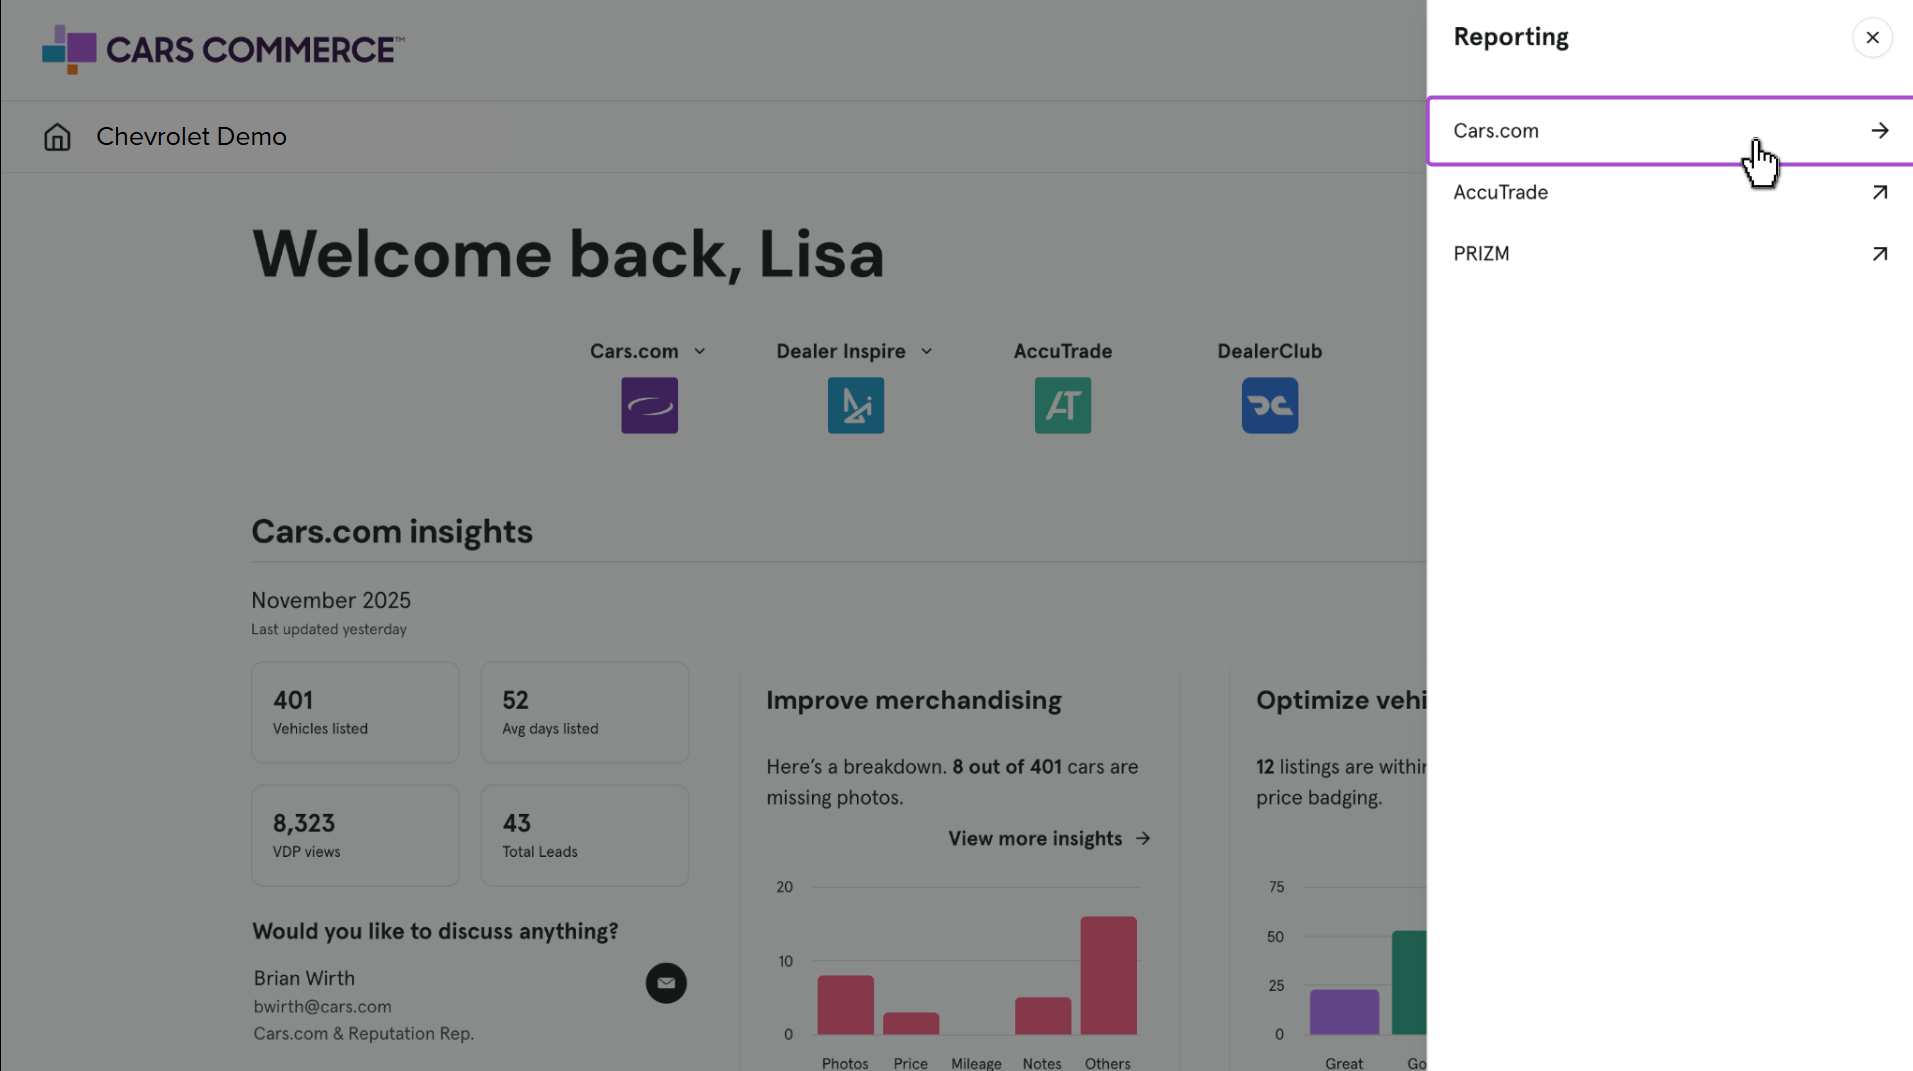
Once logged into the Hub, click Reporting, then Cars.com.
2 Select Customer Engagement
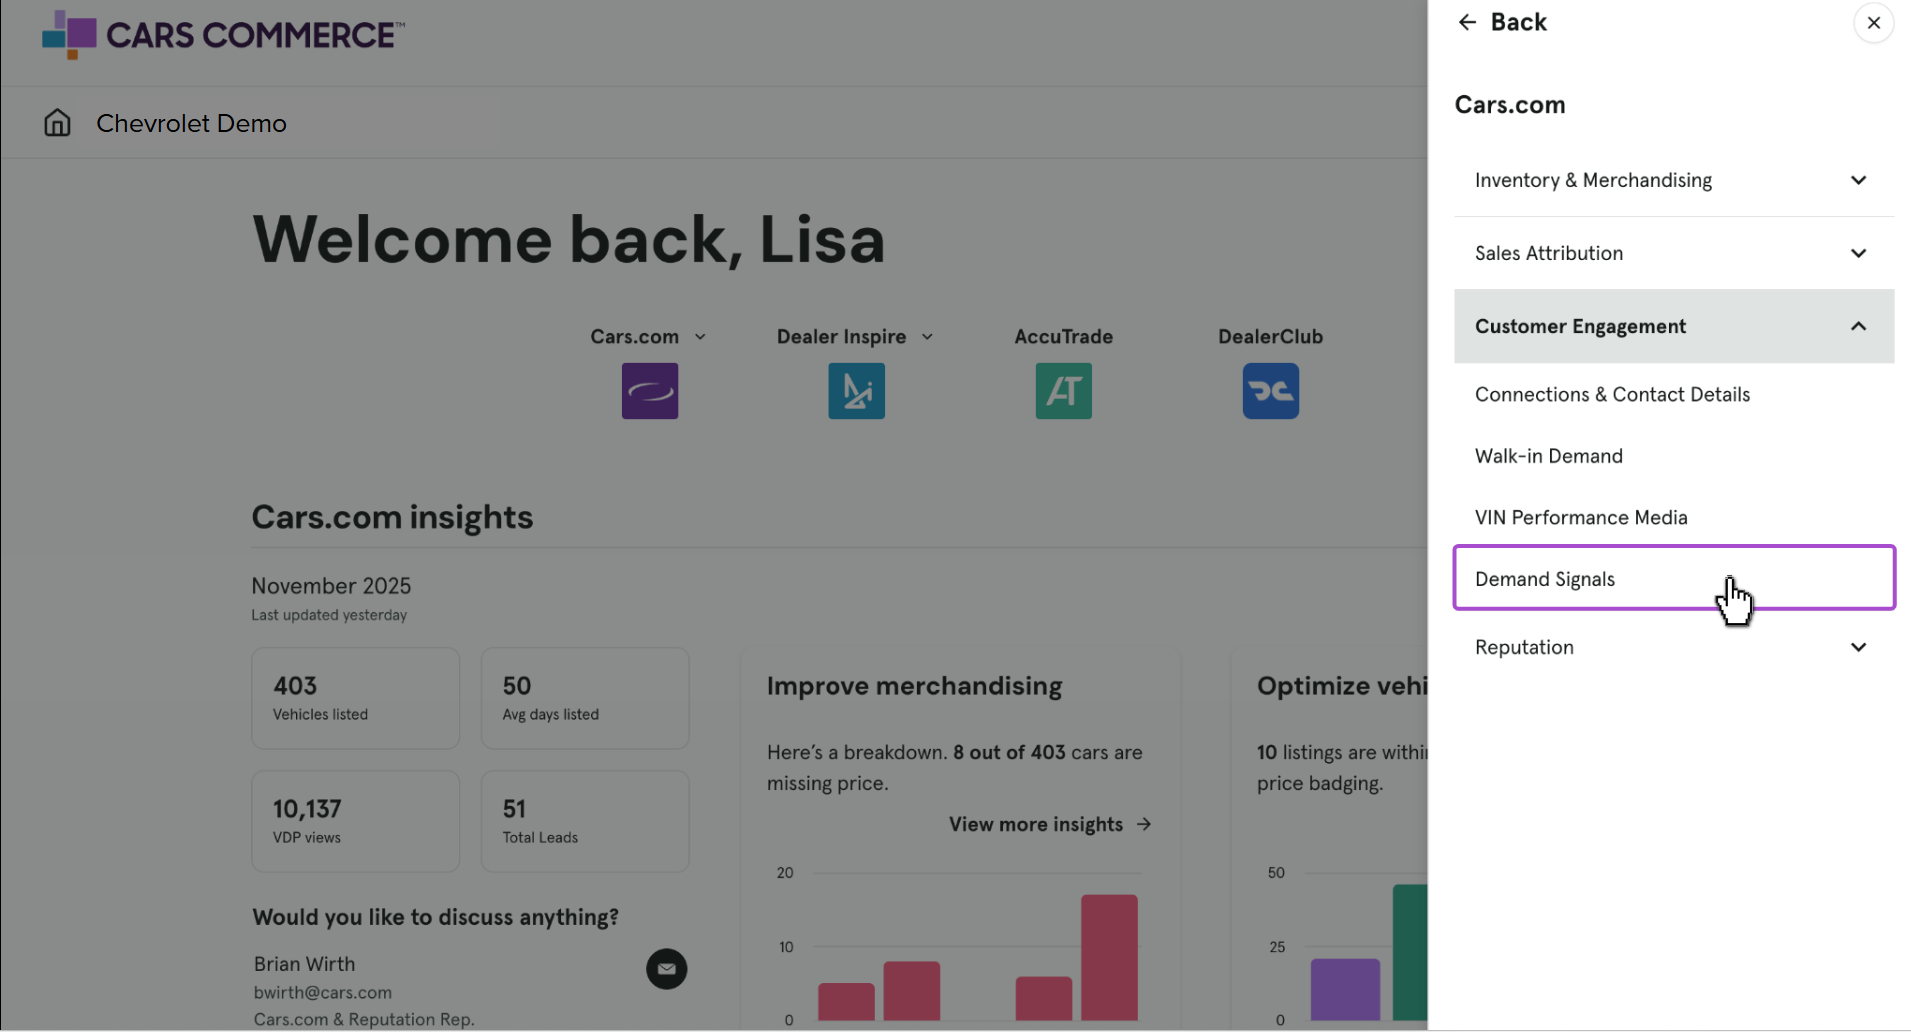
Click Customer Engagement, then the Demand Signals report from the dropdown.
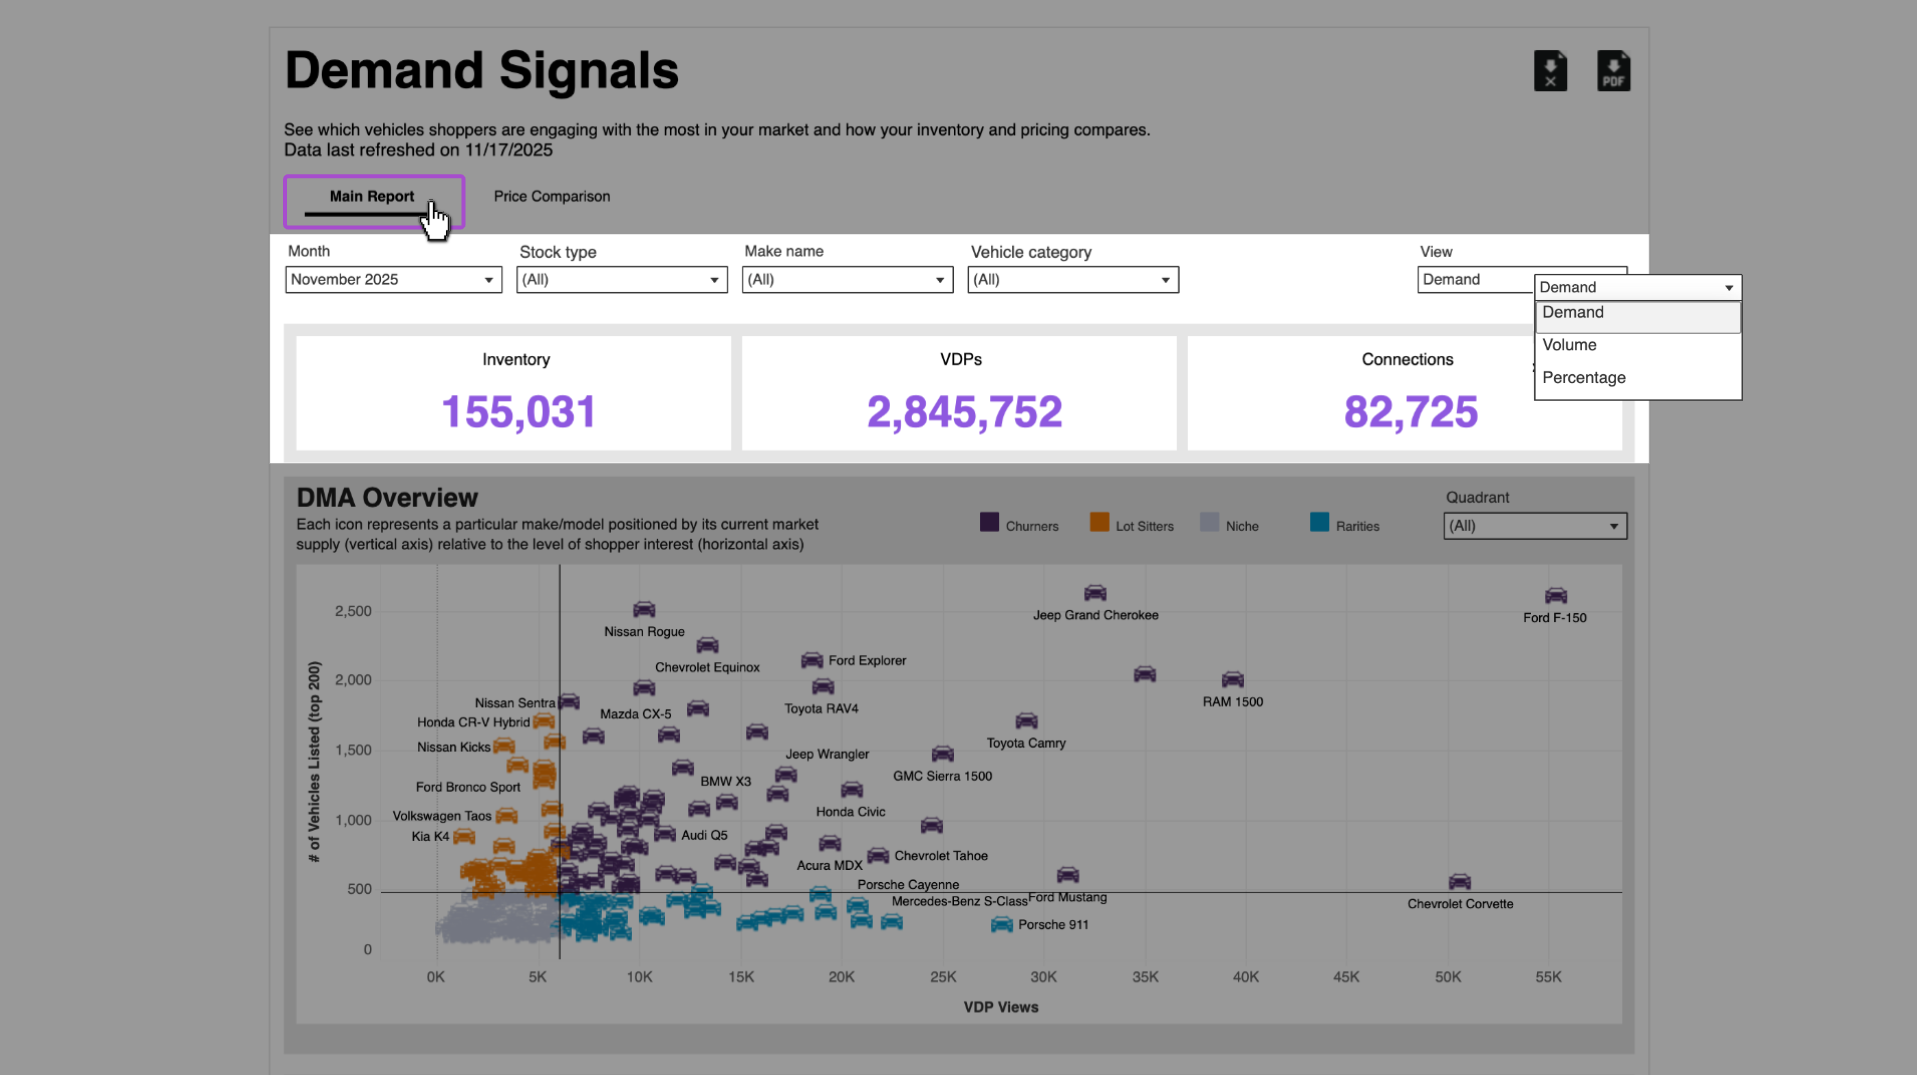
3 Review the “Main Report” tab
Apply filters to focus your view by:
- Month
- Stock Type
- Make Name
- Vehicle Category
- View Type: Toggle between Demand, Volume, and Percentage views
Snapshot Summary (monthly DMA overview):
- Inventory: Total listed units in your DMA
- VDPs: Total Vehicle Detail Page views in your DMA
- Connections: Total shopper connections in your DMA
4 Explore the DMA Overview chart
The DMA Overview report has three different views — Demand, Volume, and Percentage — which you can toggle between by selecting “View” in the top-right corner.
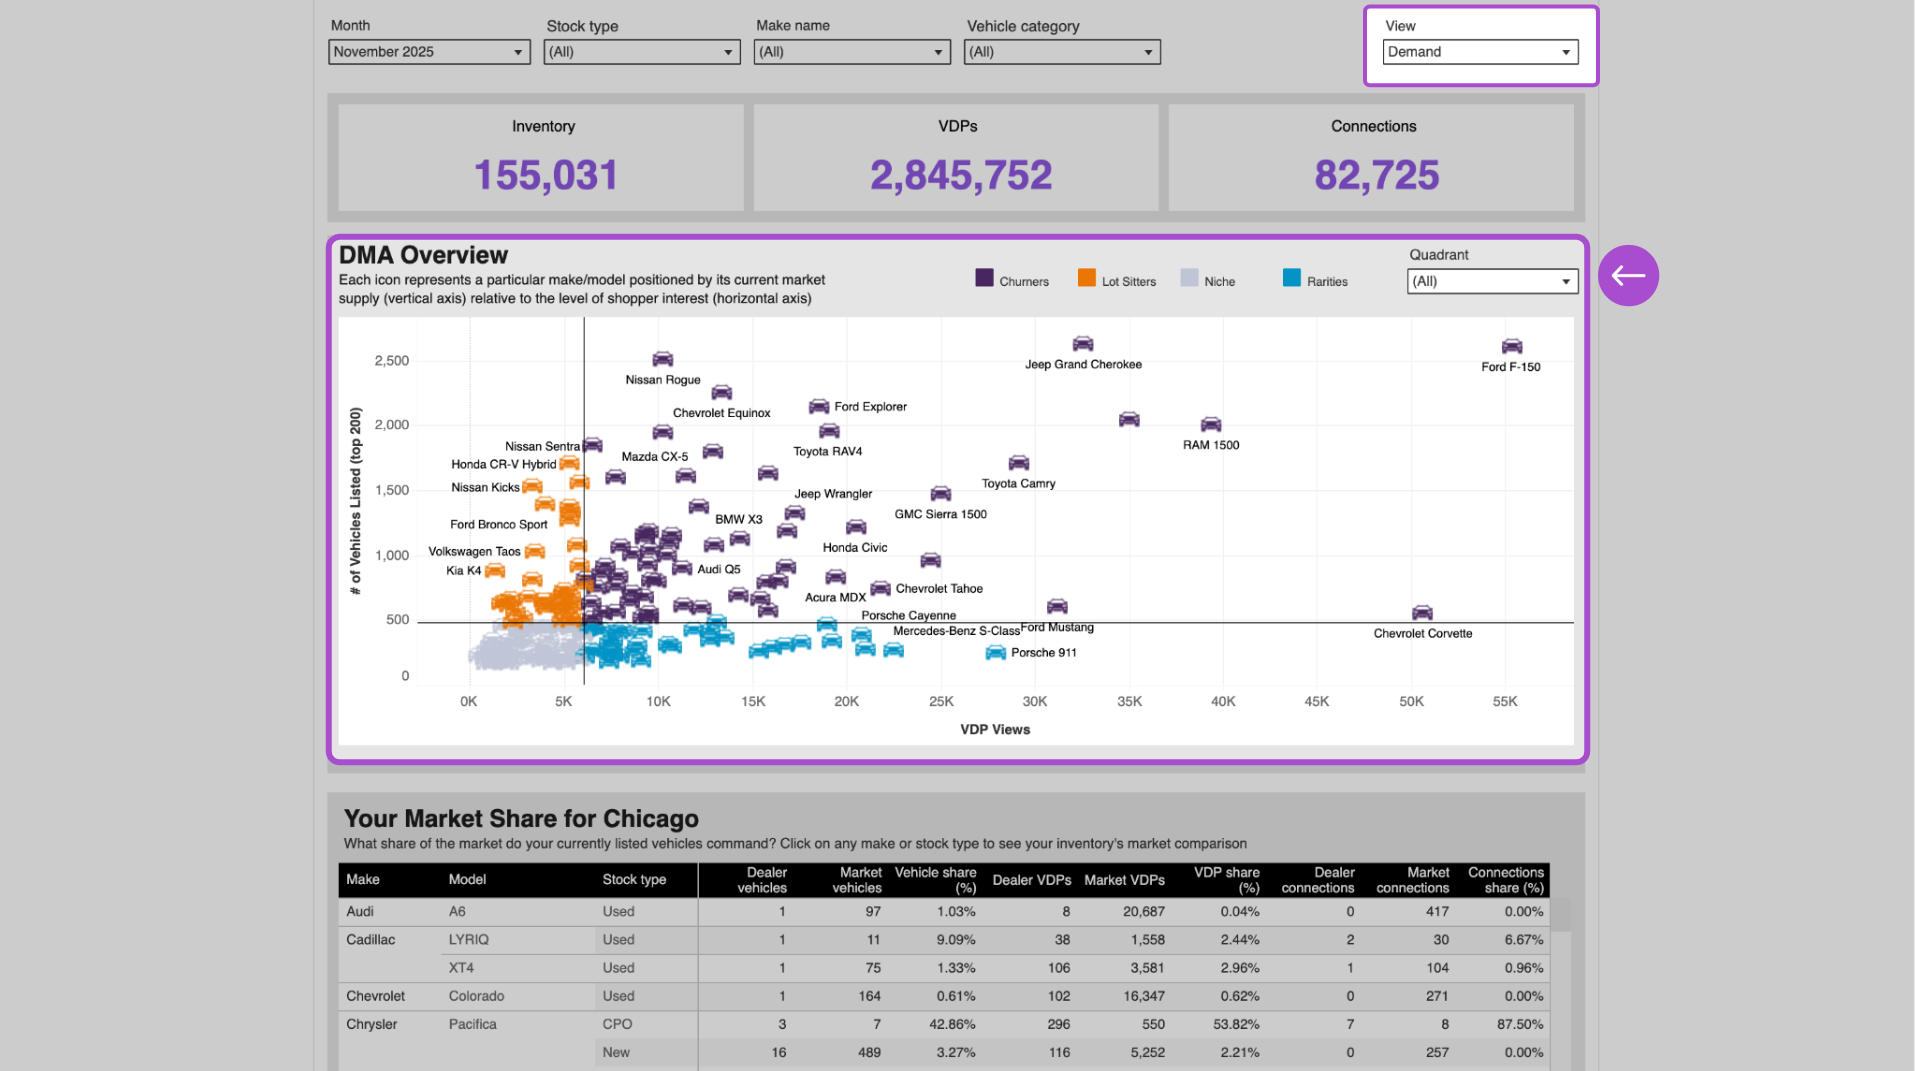
Demand View
This quadrant chart shows which inventory is turning fast or sitting idle:
- Churners: High inventory + high VDP views = fast movers
- Rarities: Low inventory + high VDP views = high shopper interest
- Lot Sitters: High inventory + low VDPs = pricing/marketing opportunity
- Niche: Low inventory + low VDPs = specialty or rare units
Note: Use the quadrant filter to focus only on Lot Sitters, Churners, etc.
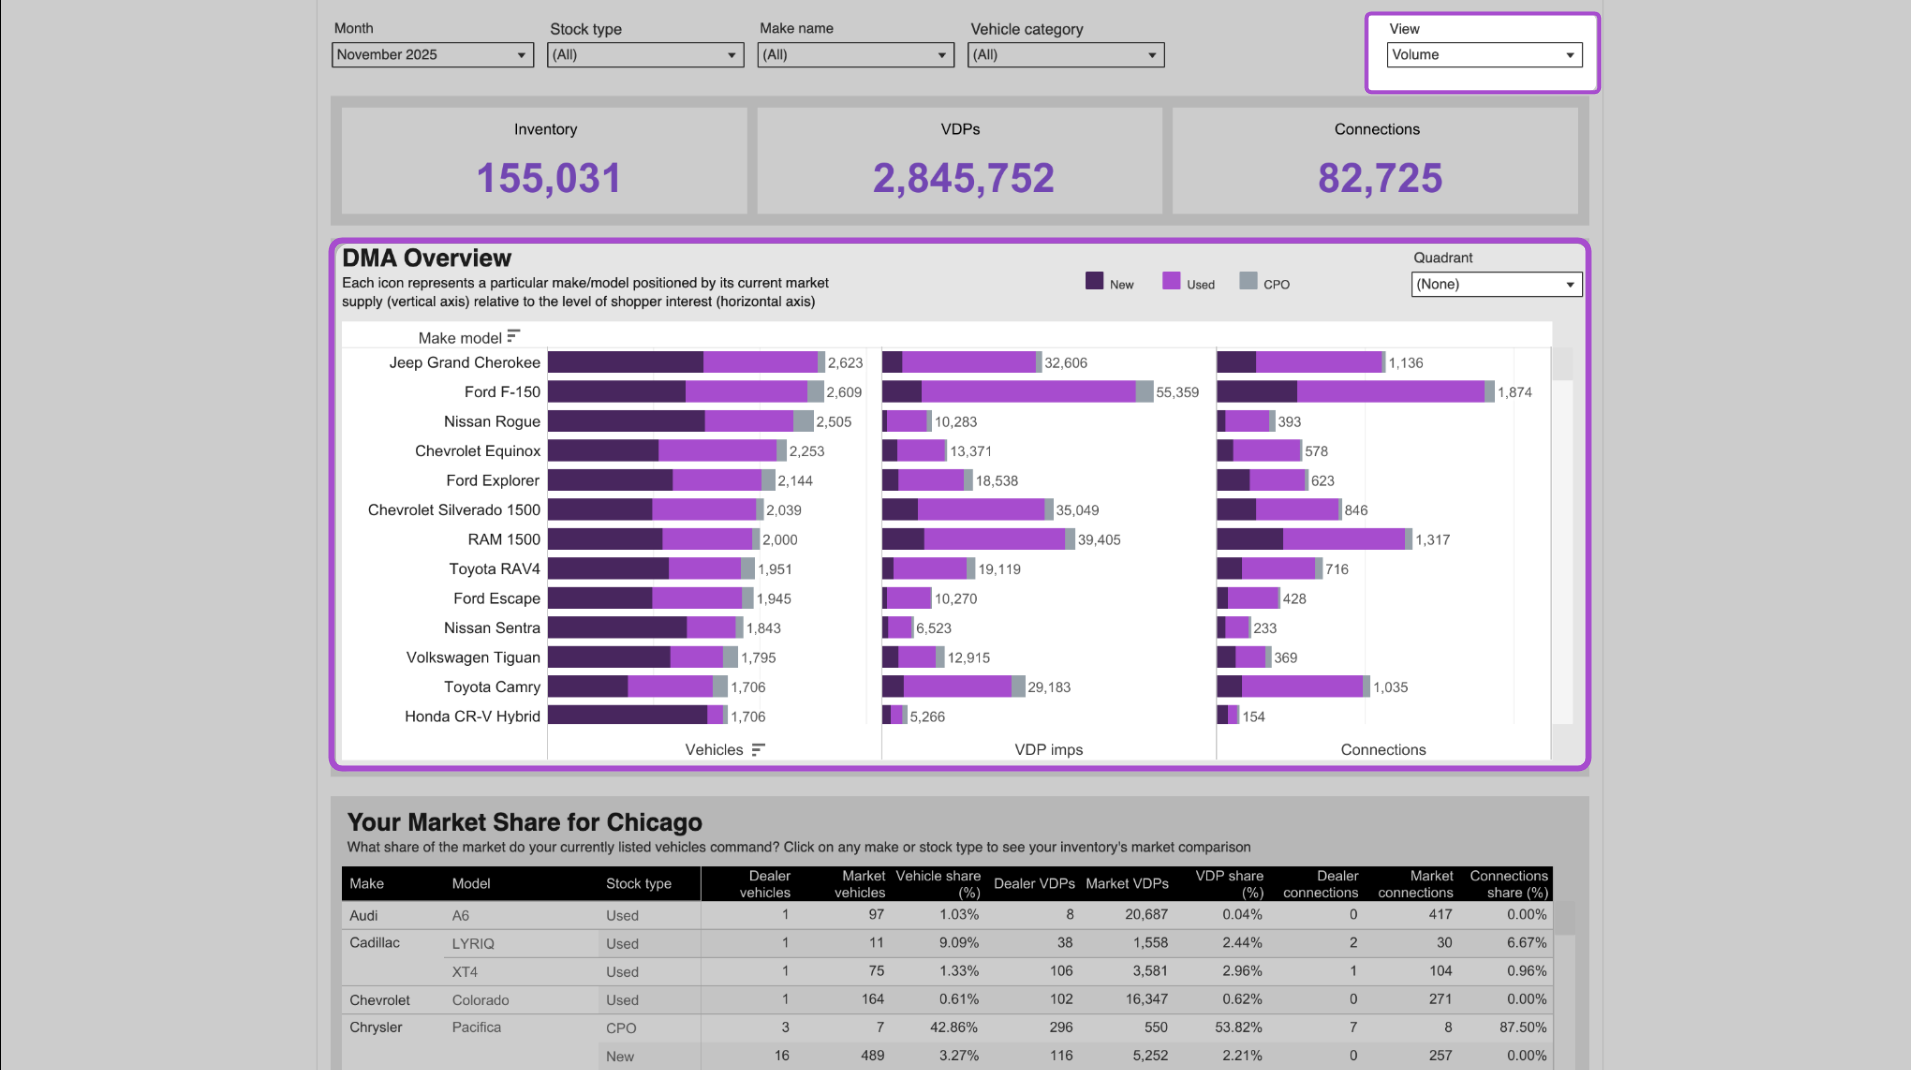
Volume View
Shows total counts of Inventory, VDPs, and Connections by make/model.
- Visualized by stock type (New, Used, CPO) with color coding
- Helps you spot overall market trends by unit count
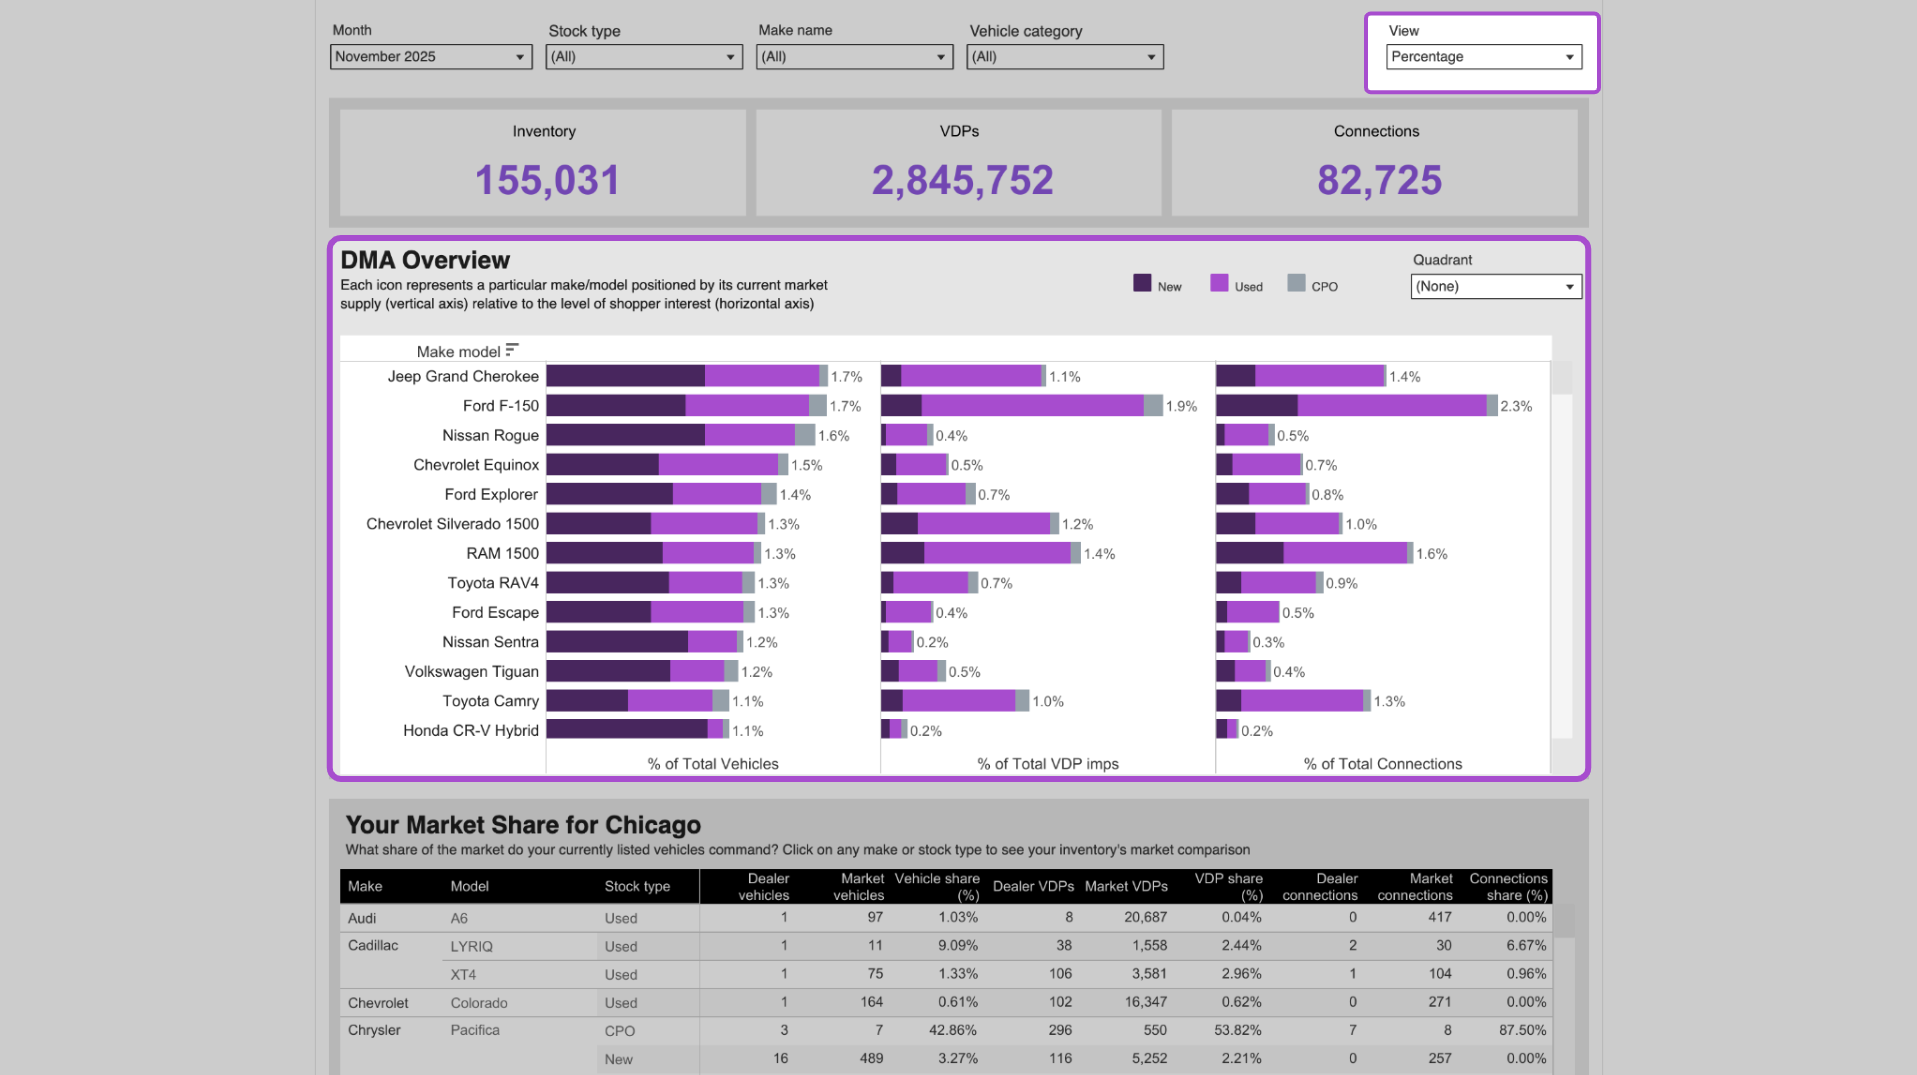
Percentage View
Shows the share of inventory, VDPs, and Connections for each make/model.
- Good for identifying over- or under-performance vs. market share
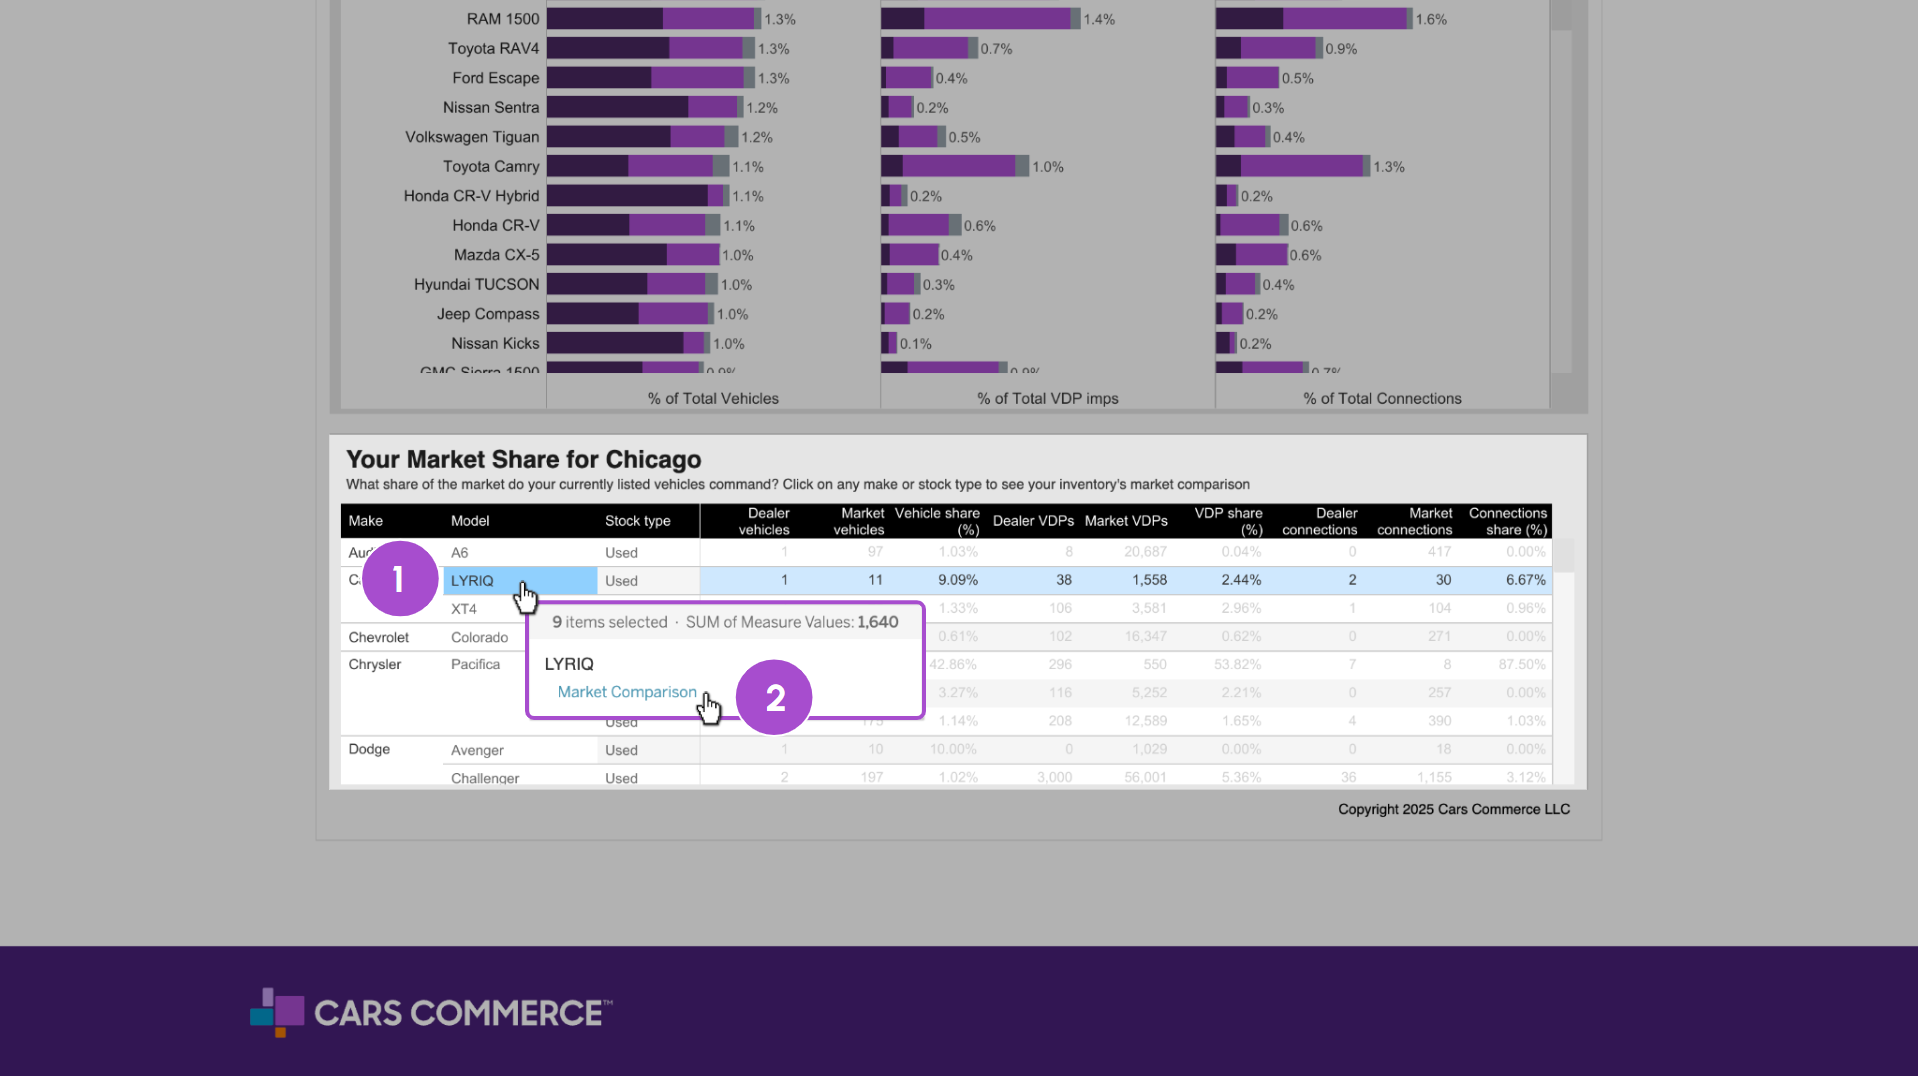
5 Review Your Market Share report
This table compares your inventory, VDP views, and Connections against the rest of the DMA for every make and model.
To analyze a specific vehicle:
- Click on a Make, Model, or Stock Type in the table
- A pop-up window will appear — click Market Comparison
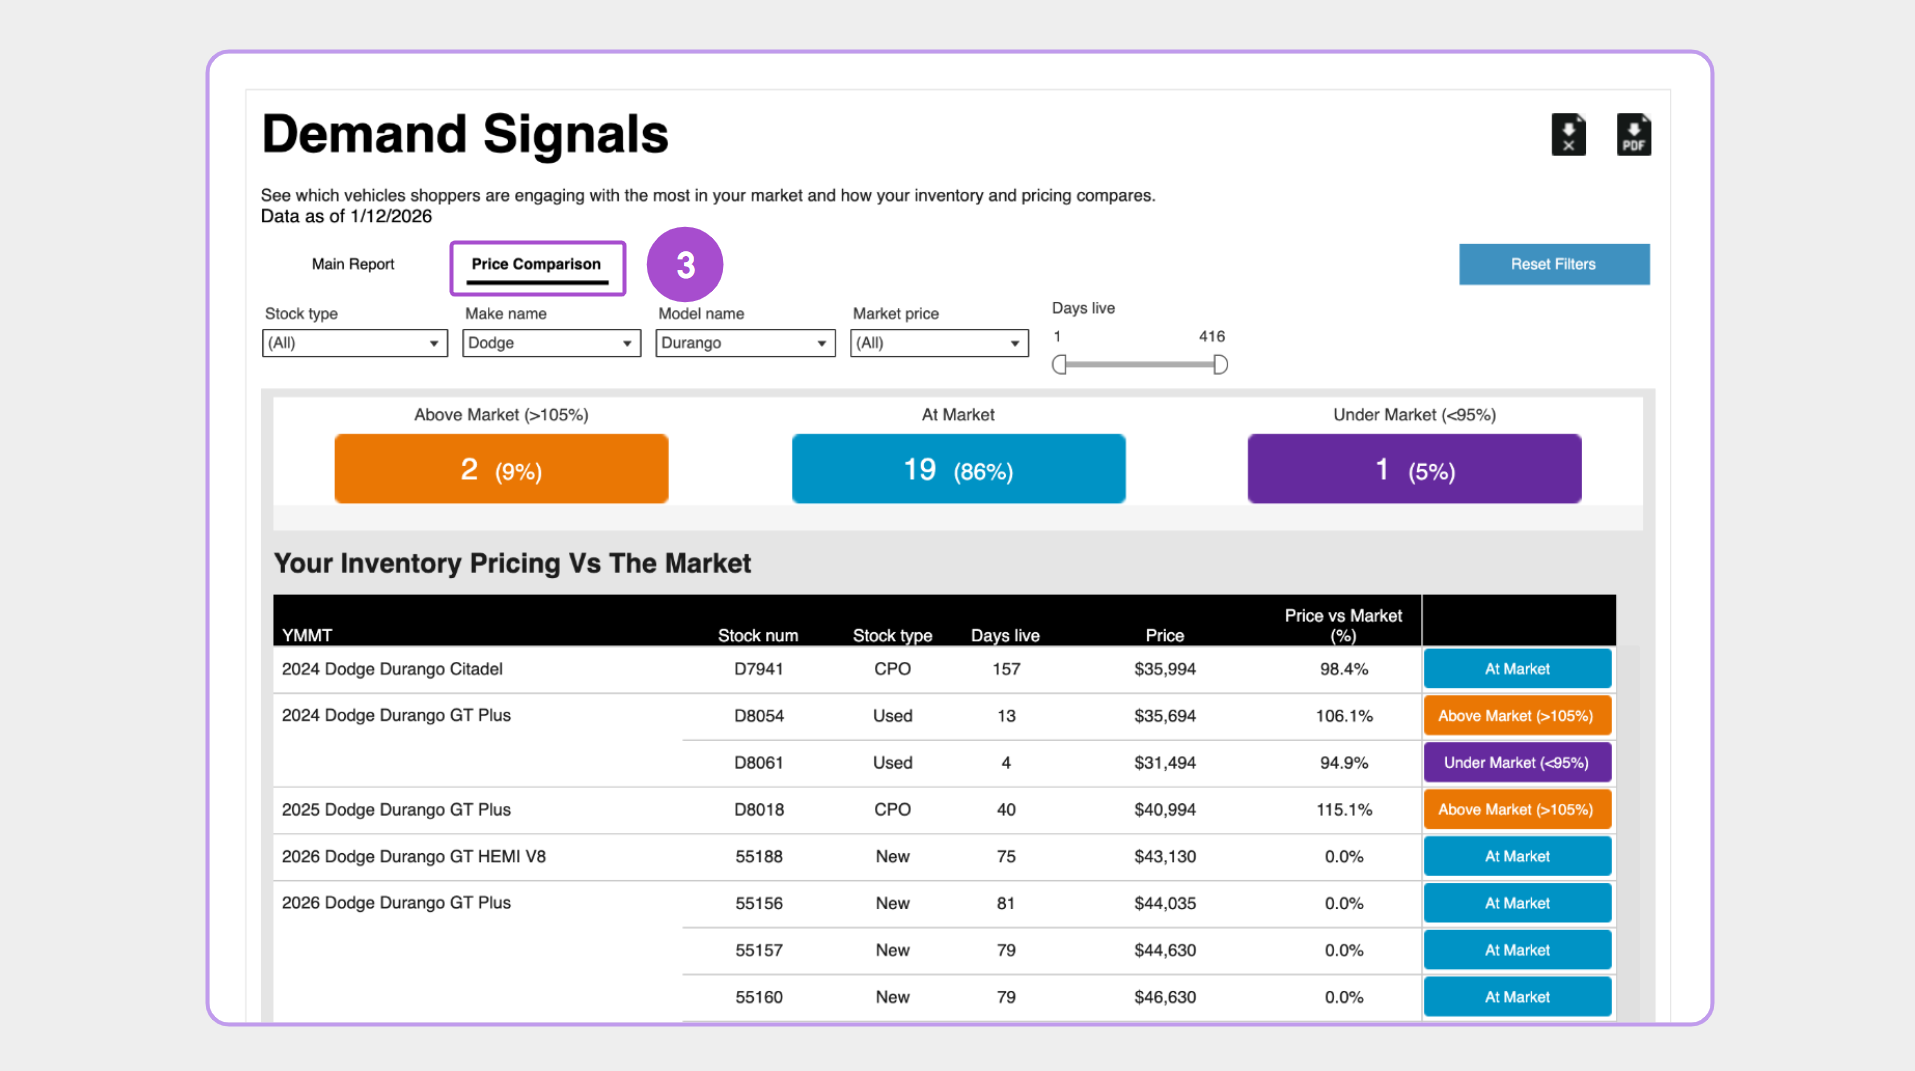
- You’ll be taken to the Price Comparison tab with filters pre-applied
6 Using the Price Comparison tab
The Price Comparison tab helps you evaluate how your current inventory is priced relative to other similar vehicles in your market — giving you a clear benchmark to adjust pricing strategy.
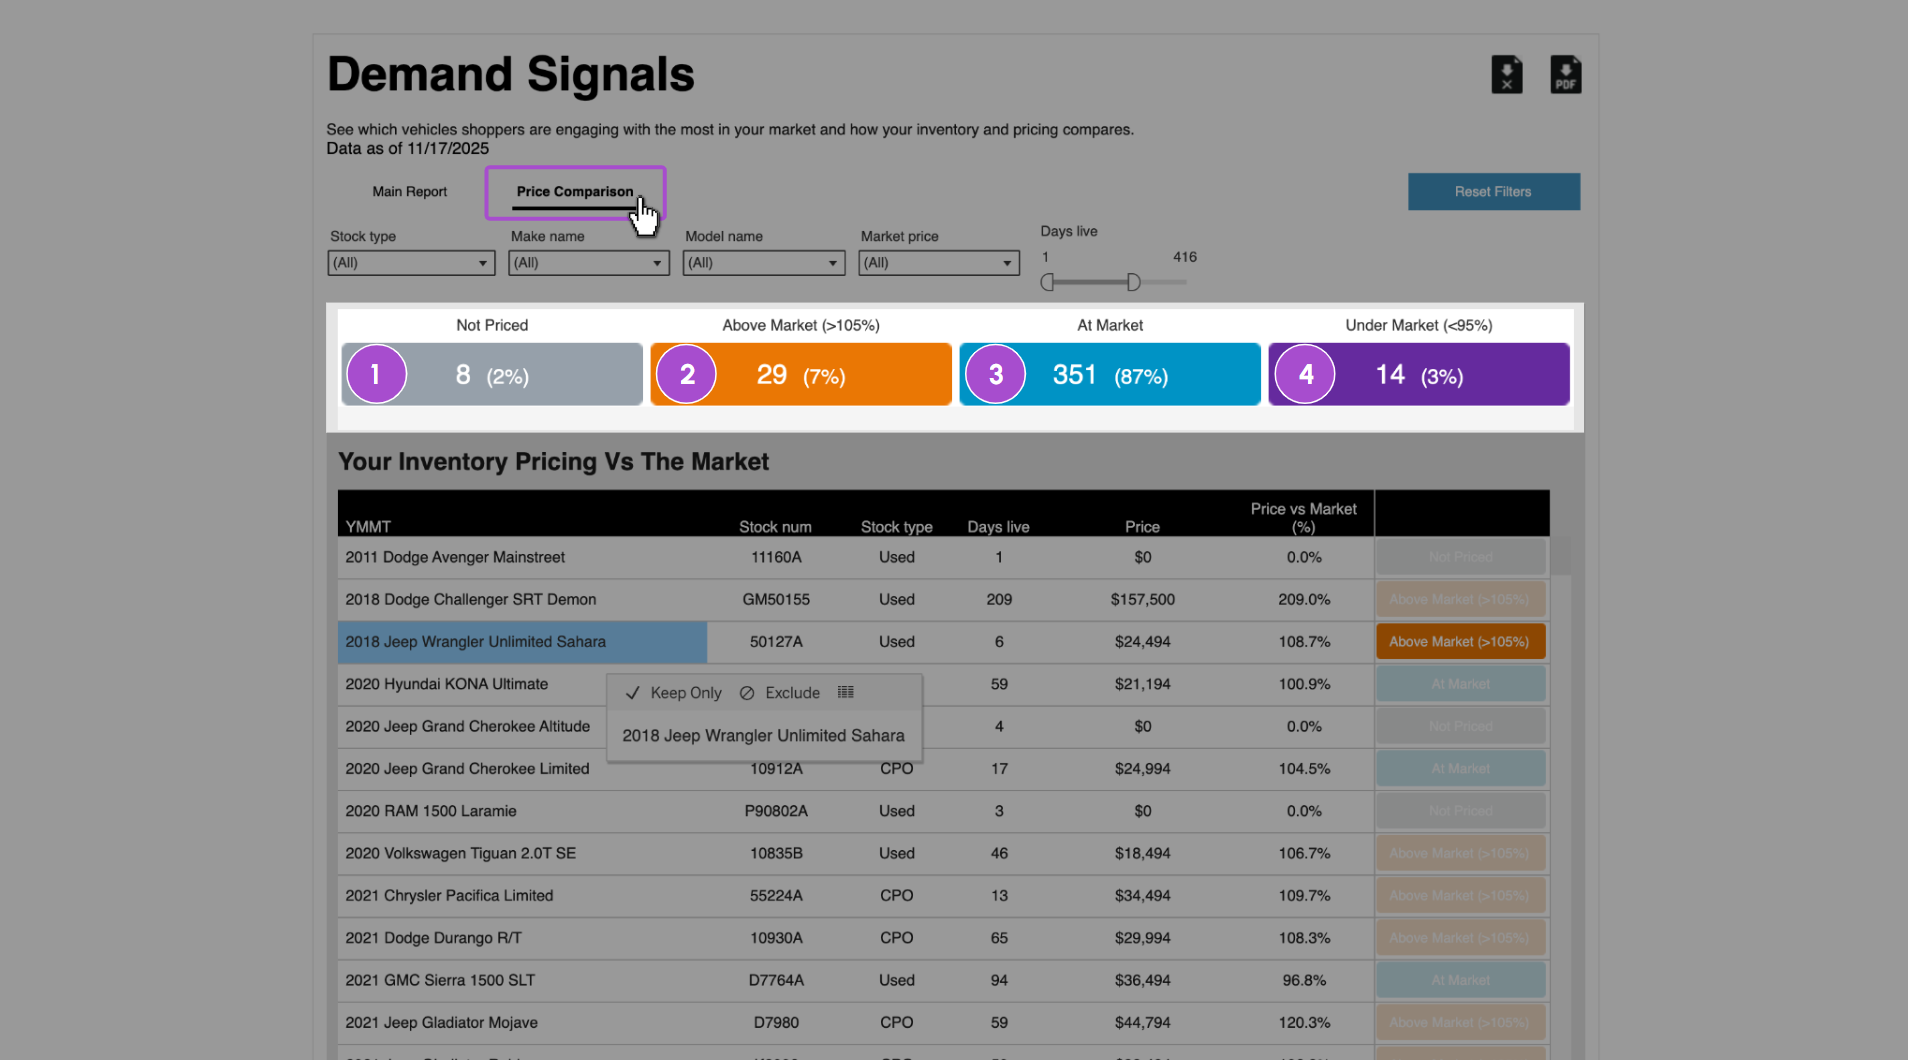
Each vehicle is categorized based on its price-to-market ratio:
- Not Priced: No price listed in your feed
- Above Market: Priced at or above 105% of the market average
- At Market: Priced between 95–105% of the market average
- Under Market: Priced at or below 95% of the market average
This comparison is based on Year, Make, Model, and Trim (YMMT) within your DMA.
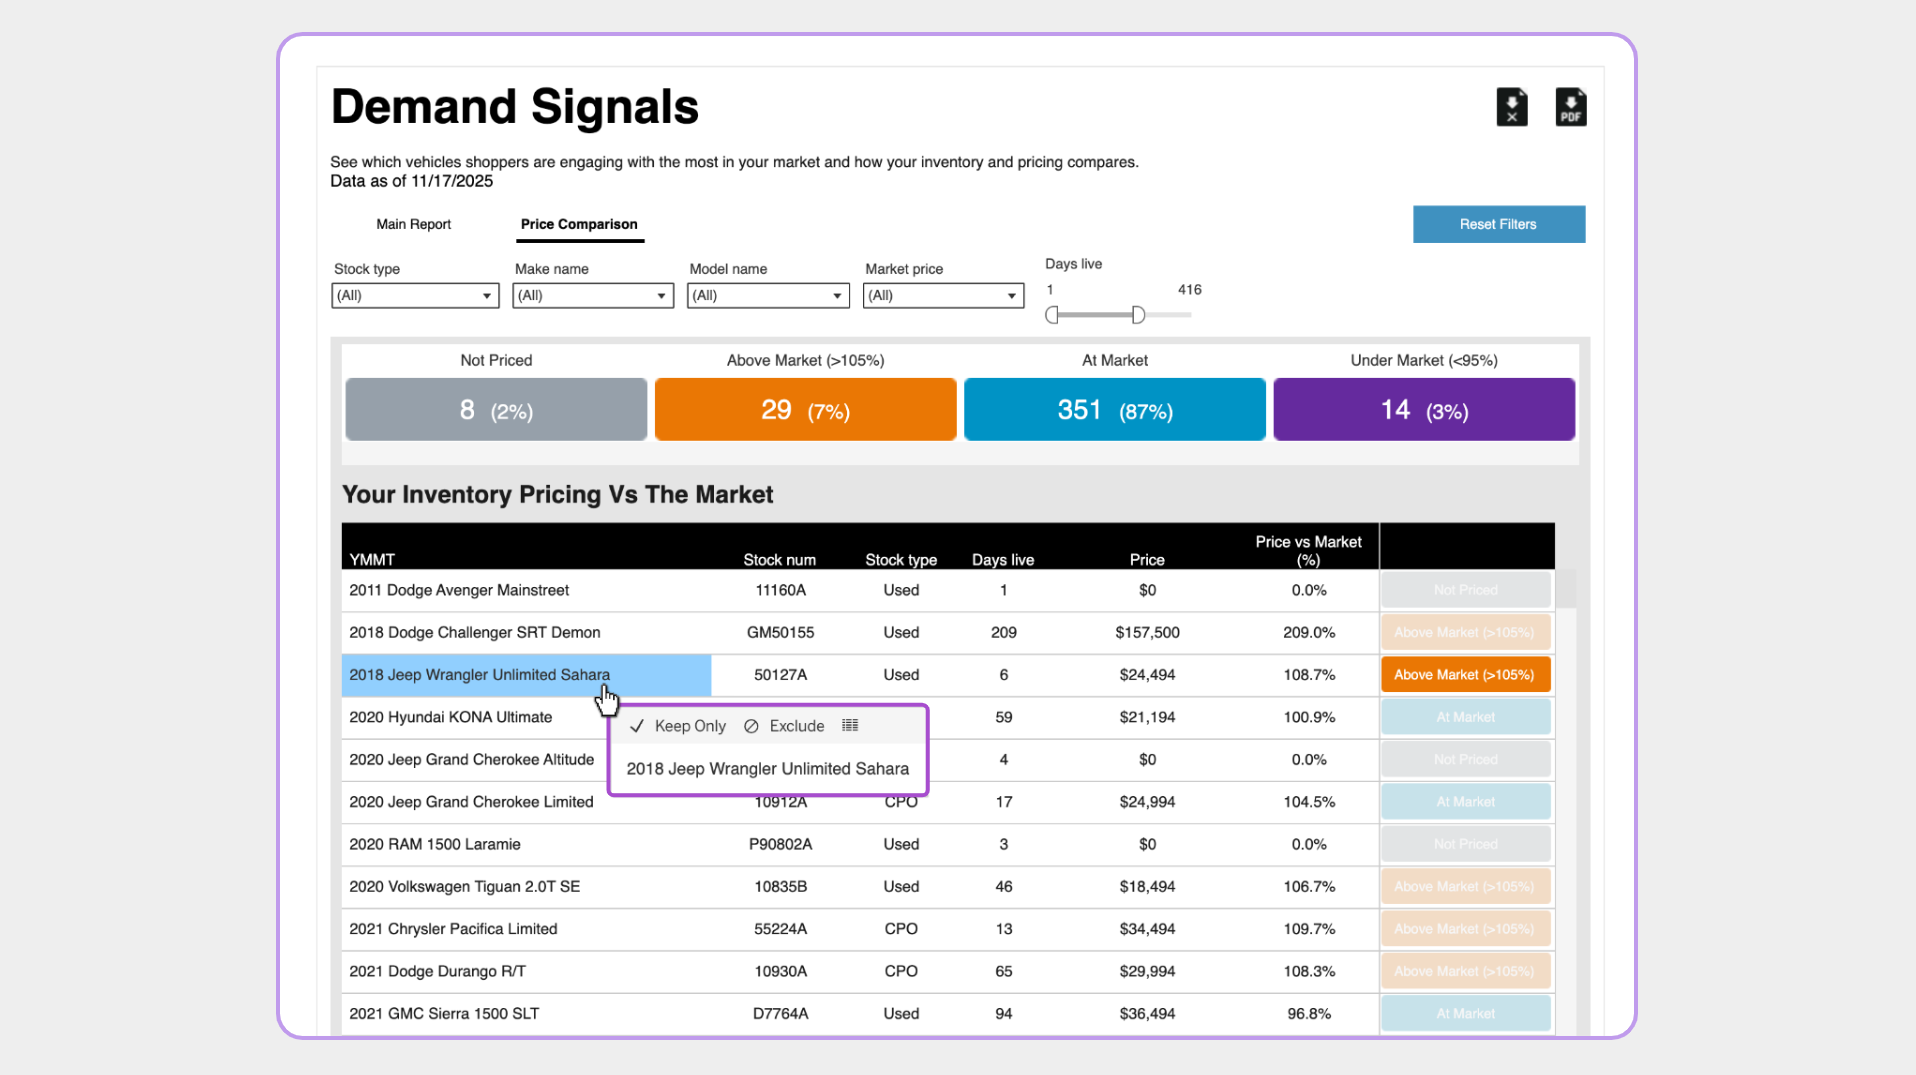
To analyze pricing for a specific type of vehicle:
- Identify the Make, Model, or Stock Type you want to evaluate in the chart.
- Click into that row to bring up a side-by-side comparison of your pricing vs. the local market.
- Then click Market Comparison to see a filtered view of all vehicles in that category — shown within the Price Comparison tab.
This same comparison can also be accessed from the Market Share section in the main report tab.
Use this insight to quickly spot overpriced or underperforming vehicles — and take action on re-pricing or wholesaling.
7 Filter & reset for deeper insights
Use filters at the top of the screen to drill into specific makes, trims, or stock types — or click Reset Filters to return to the default view.