How to leverage Cost to Market
Cost to Market (CTM) is a metric that helps you evaluate vehicle pricing and make informed acquisition and exit decisions.
In this article, you’ll learn how to locate and review Cost to Market percentages for vehicles in your inventory, adjust the inputs that affect those percentages, evaluate your competitive set, and use Cost to Market alongside exit strategy options to make informed pricing decisions.
To get started
Go to the Cars.com Hub, and click on AccuTrade.
What is Cost to Market?
Cost to Market is calculated as the ratio of a vehicle’s cost to its market value, expressed as a percentage. This metric helps dealers make informed pricing decisions by comparing the vehicle’s cost to its average retail price for similar vehicles in the market.
Example:
- Vehicle cost: $20,000
- Market value: $25,000
- Cost to Market: 80%
A lower CTM indicates strong profit potential, while a higher CTM suggests limited profit potential.
1 Select a vehicle from your inventory
- Click the Inventory tab.
- The Cost to Market column shows cost-to-market percentages for all vehicles in your inventory.
- Search for and select a vehicle to see more details about its cost to market.

2 Review costs and pricing
Click the Market Pricing tab. Before checking Price to Market percentages, review the acquisition details in the Pricing Calculator and make any needed adjustments:
- ACV: Actual Cash Value
- Reconditioning: Recon costs
- Pack and fees: Pack and other fees
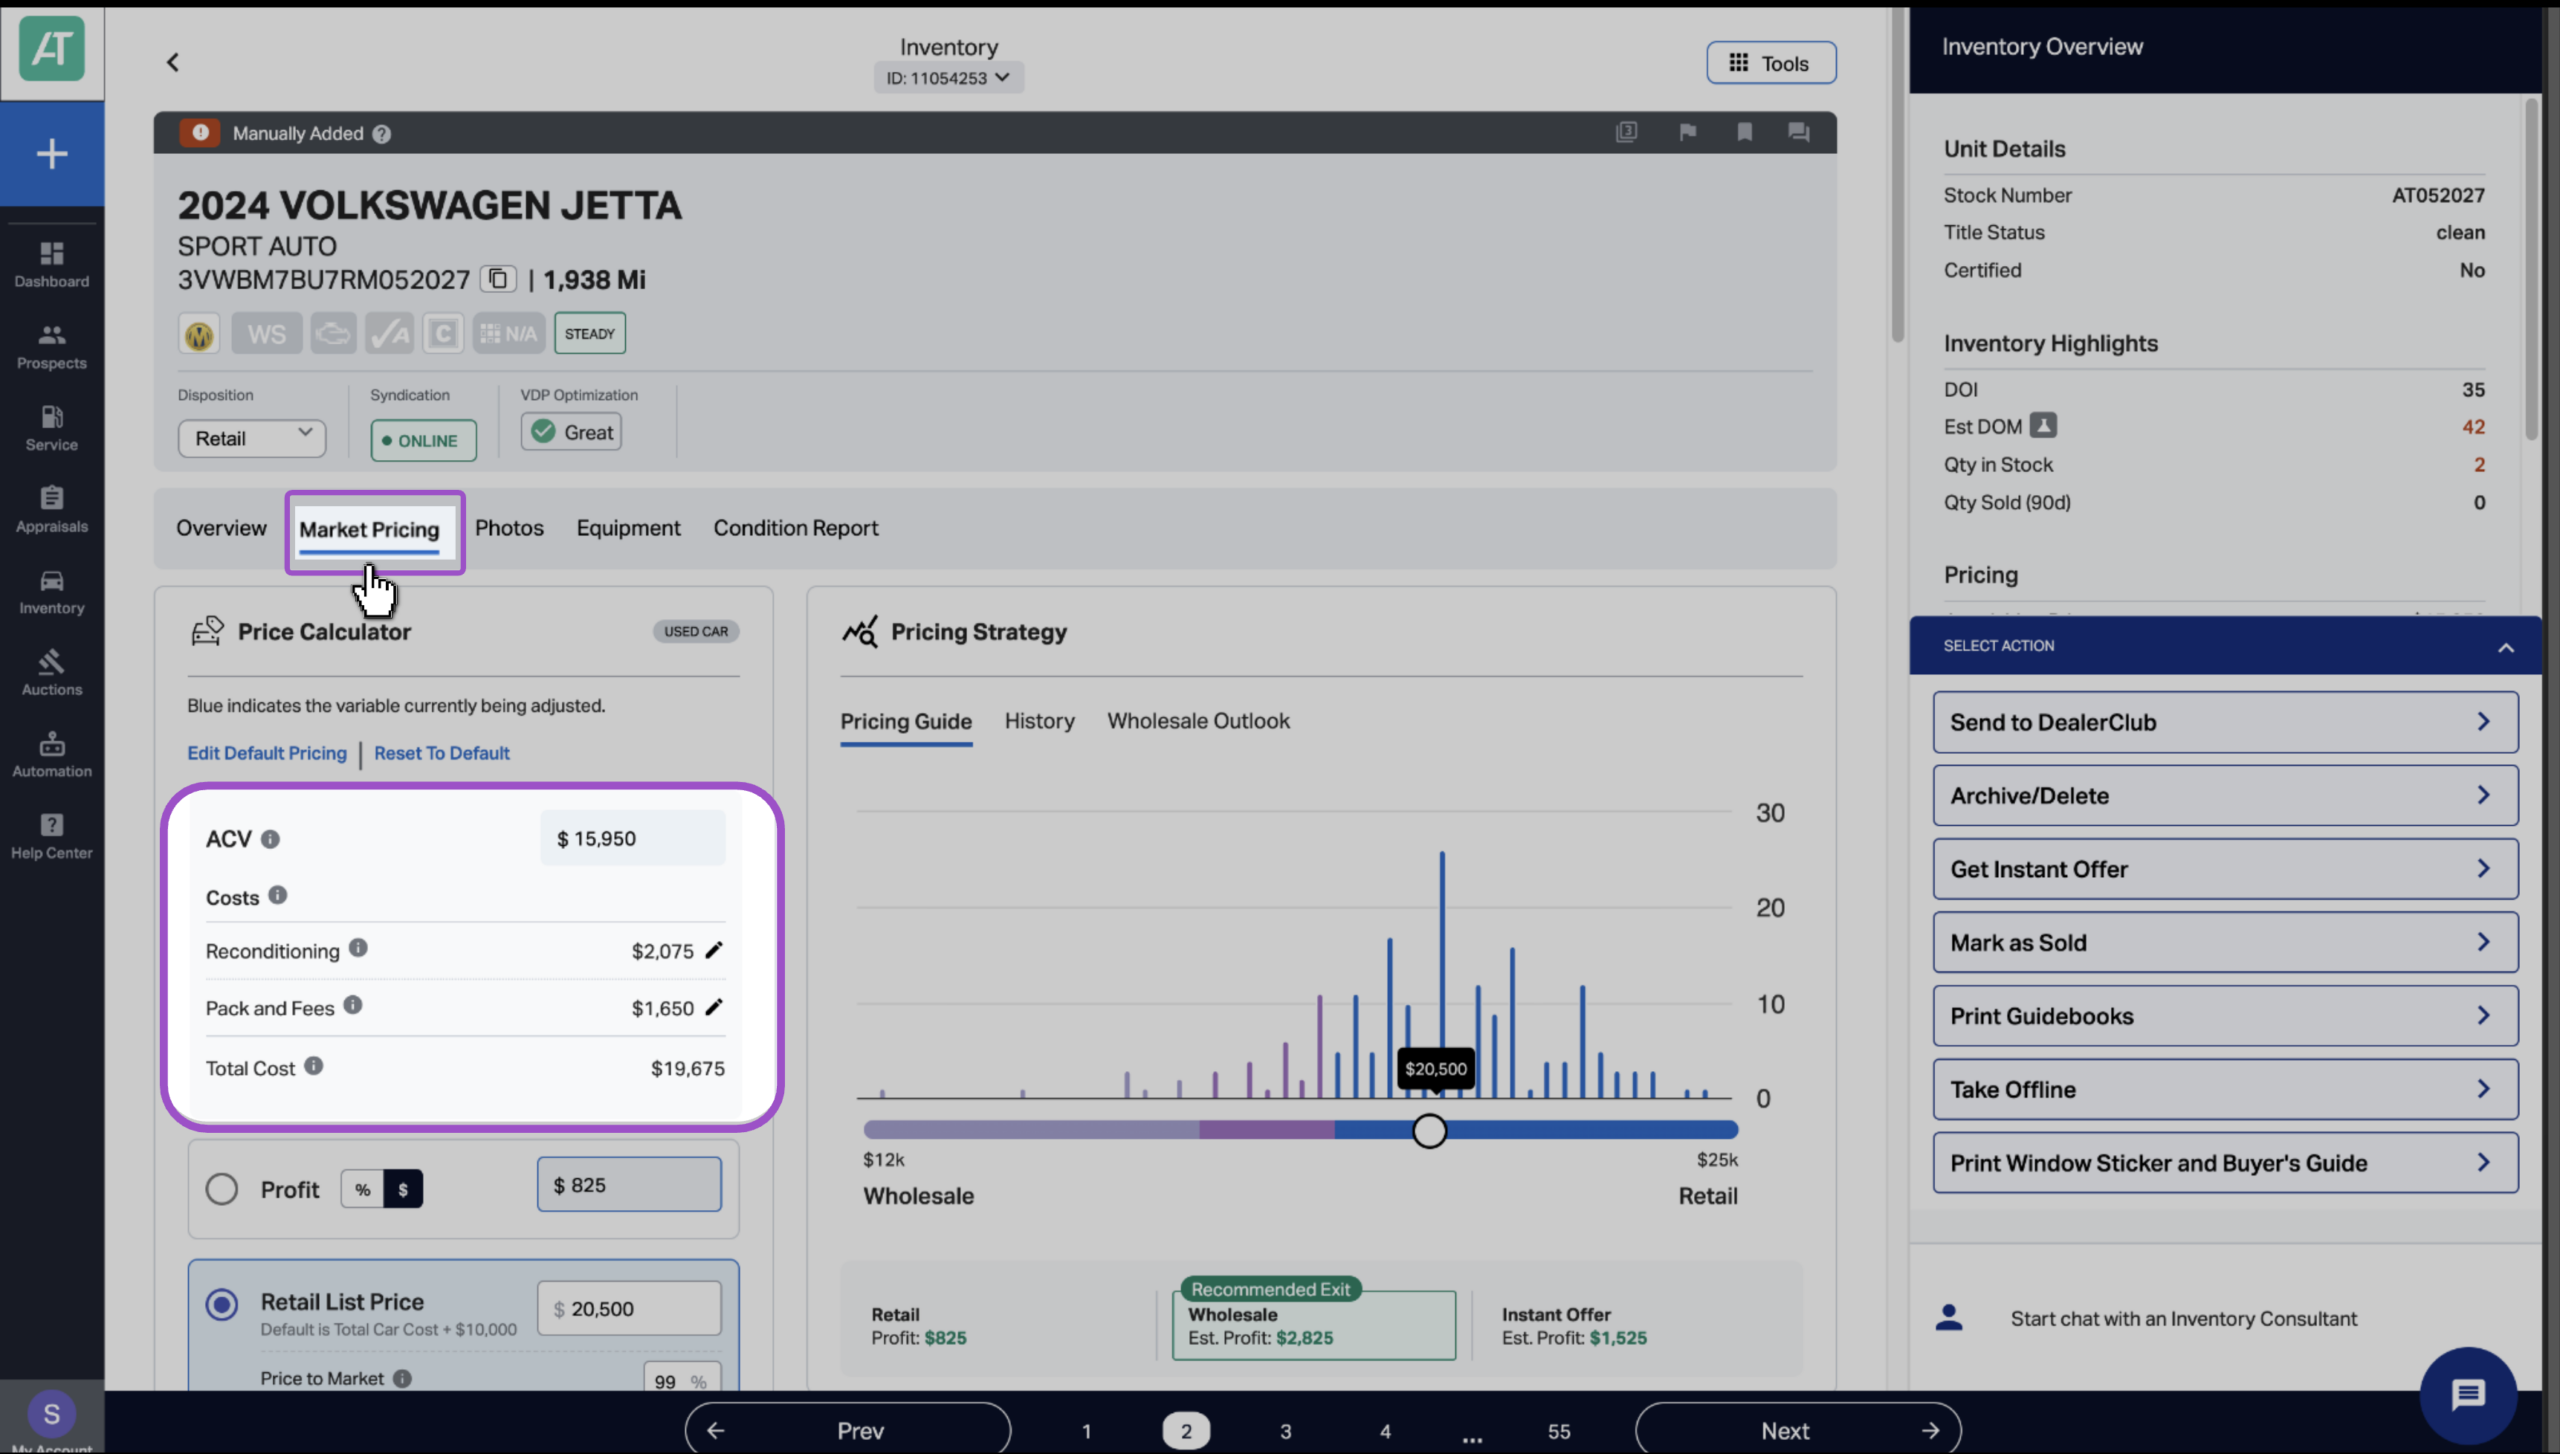
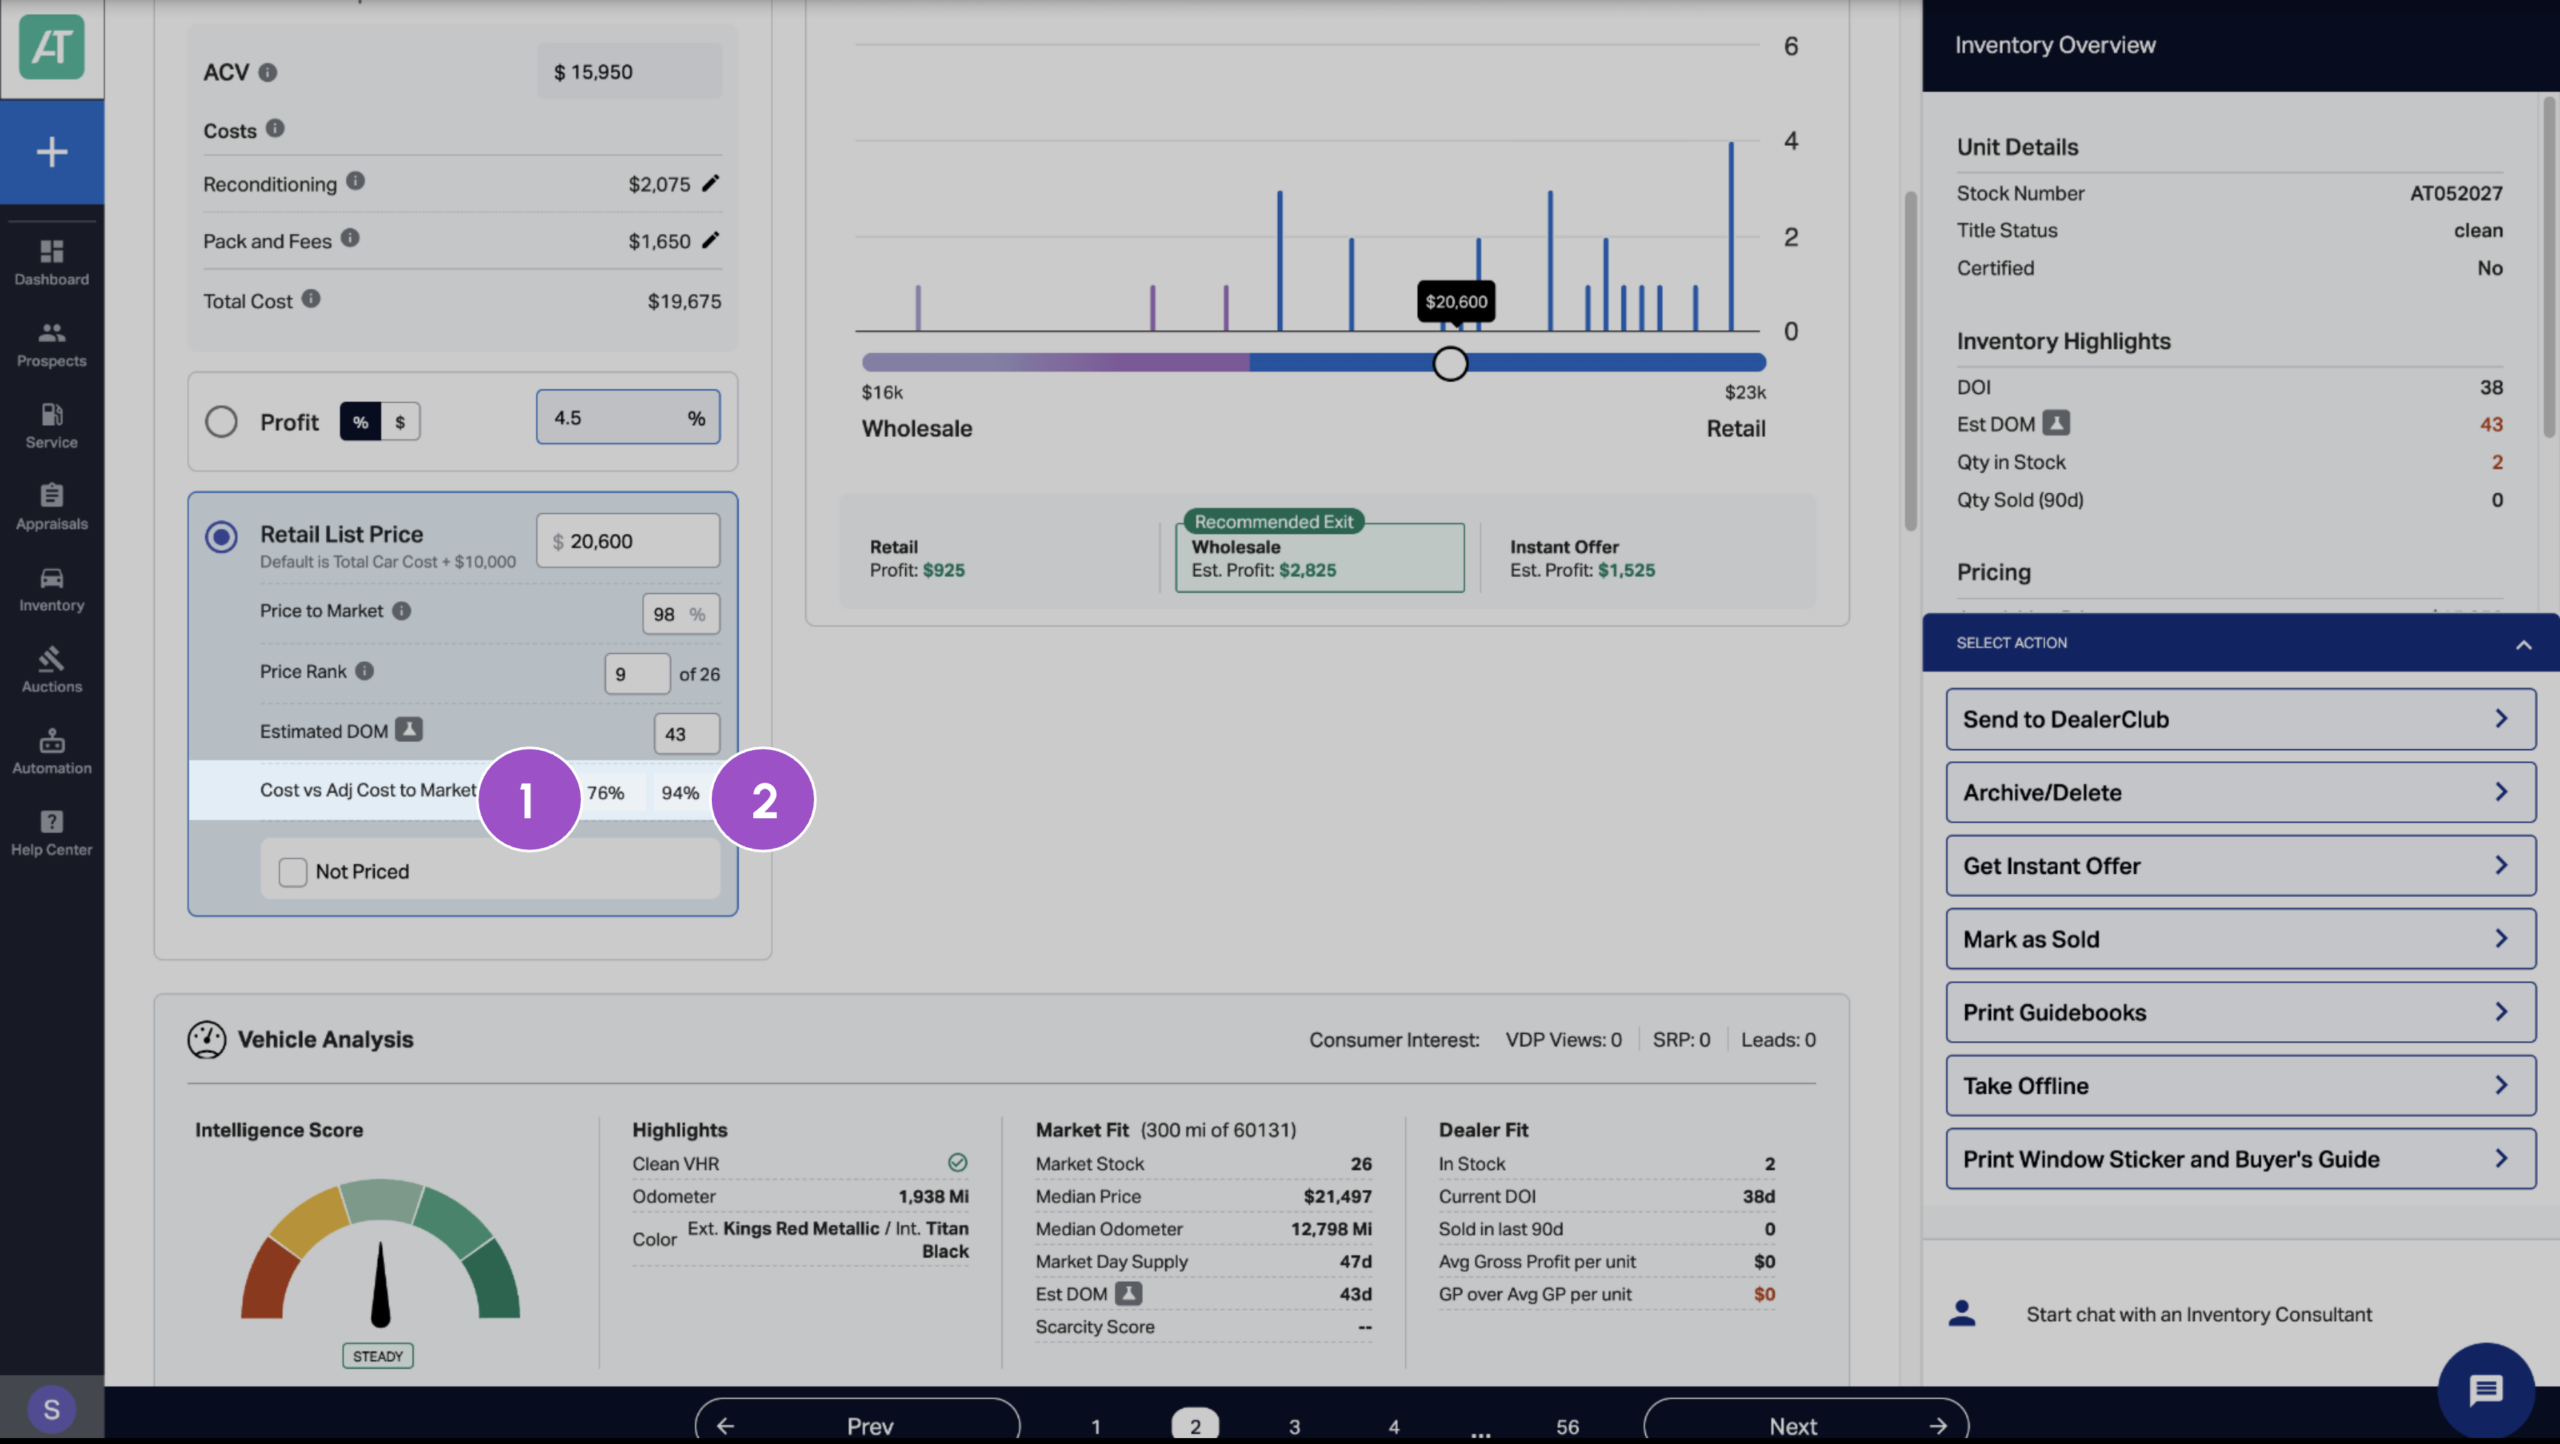
3 View cost-to-market ratios
In the Retail List Price section, you’ll see two critical metrics:
- Cost to Market percentage (Cost)
Shows the vehicle’s Actual Cash Value (ACV) as a percentage of the competitive average price. - Adjusted Cost to Market (Adj Cost to Market)
Factors in the Total Car Cost (including recon costs and fees) as a percentage of the competitive retail price average.
Together, these metrics tell you whether you overpaid on acquisition, how much margin you have to work with, and if the vehicle is worth retailing.
4 Review your competitive set
Adjusting the vehicle’s competitive set changes the Cost vs Adj Cost to Market percentages. To change the competitive set, scroll down to the Similar Vehicles section and make sure it is properly defined:
- Verify search radius (default is 200 miles)
- Filter by seller type if needed
- Use “Set More Like Mine” for tighter comparison
- Manually exclude outliers
Competitive set data refreshes daily, ensuring your price-to-market strategy reflects current market conditions.
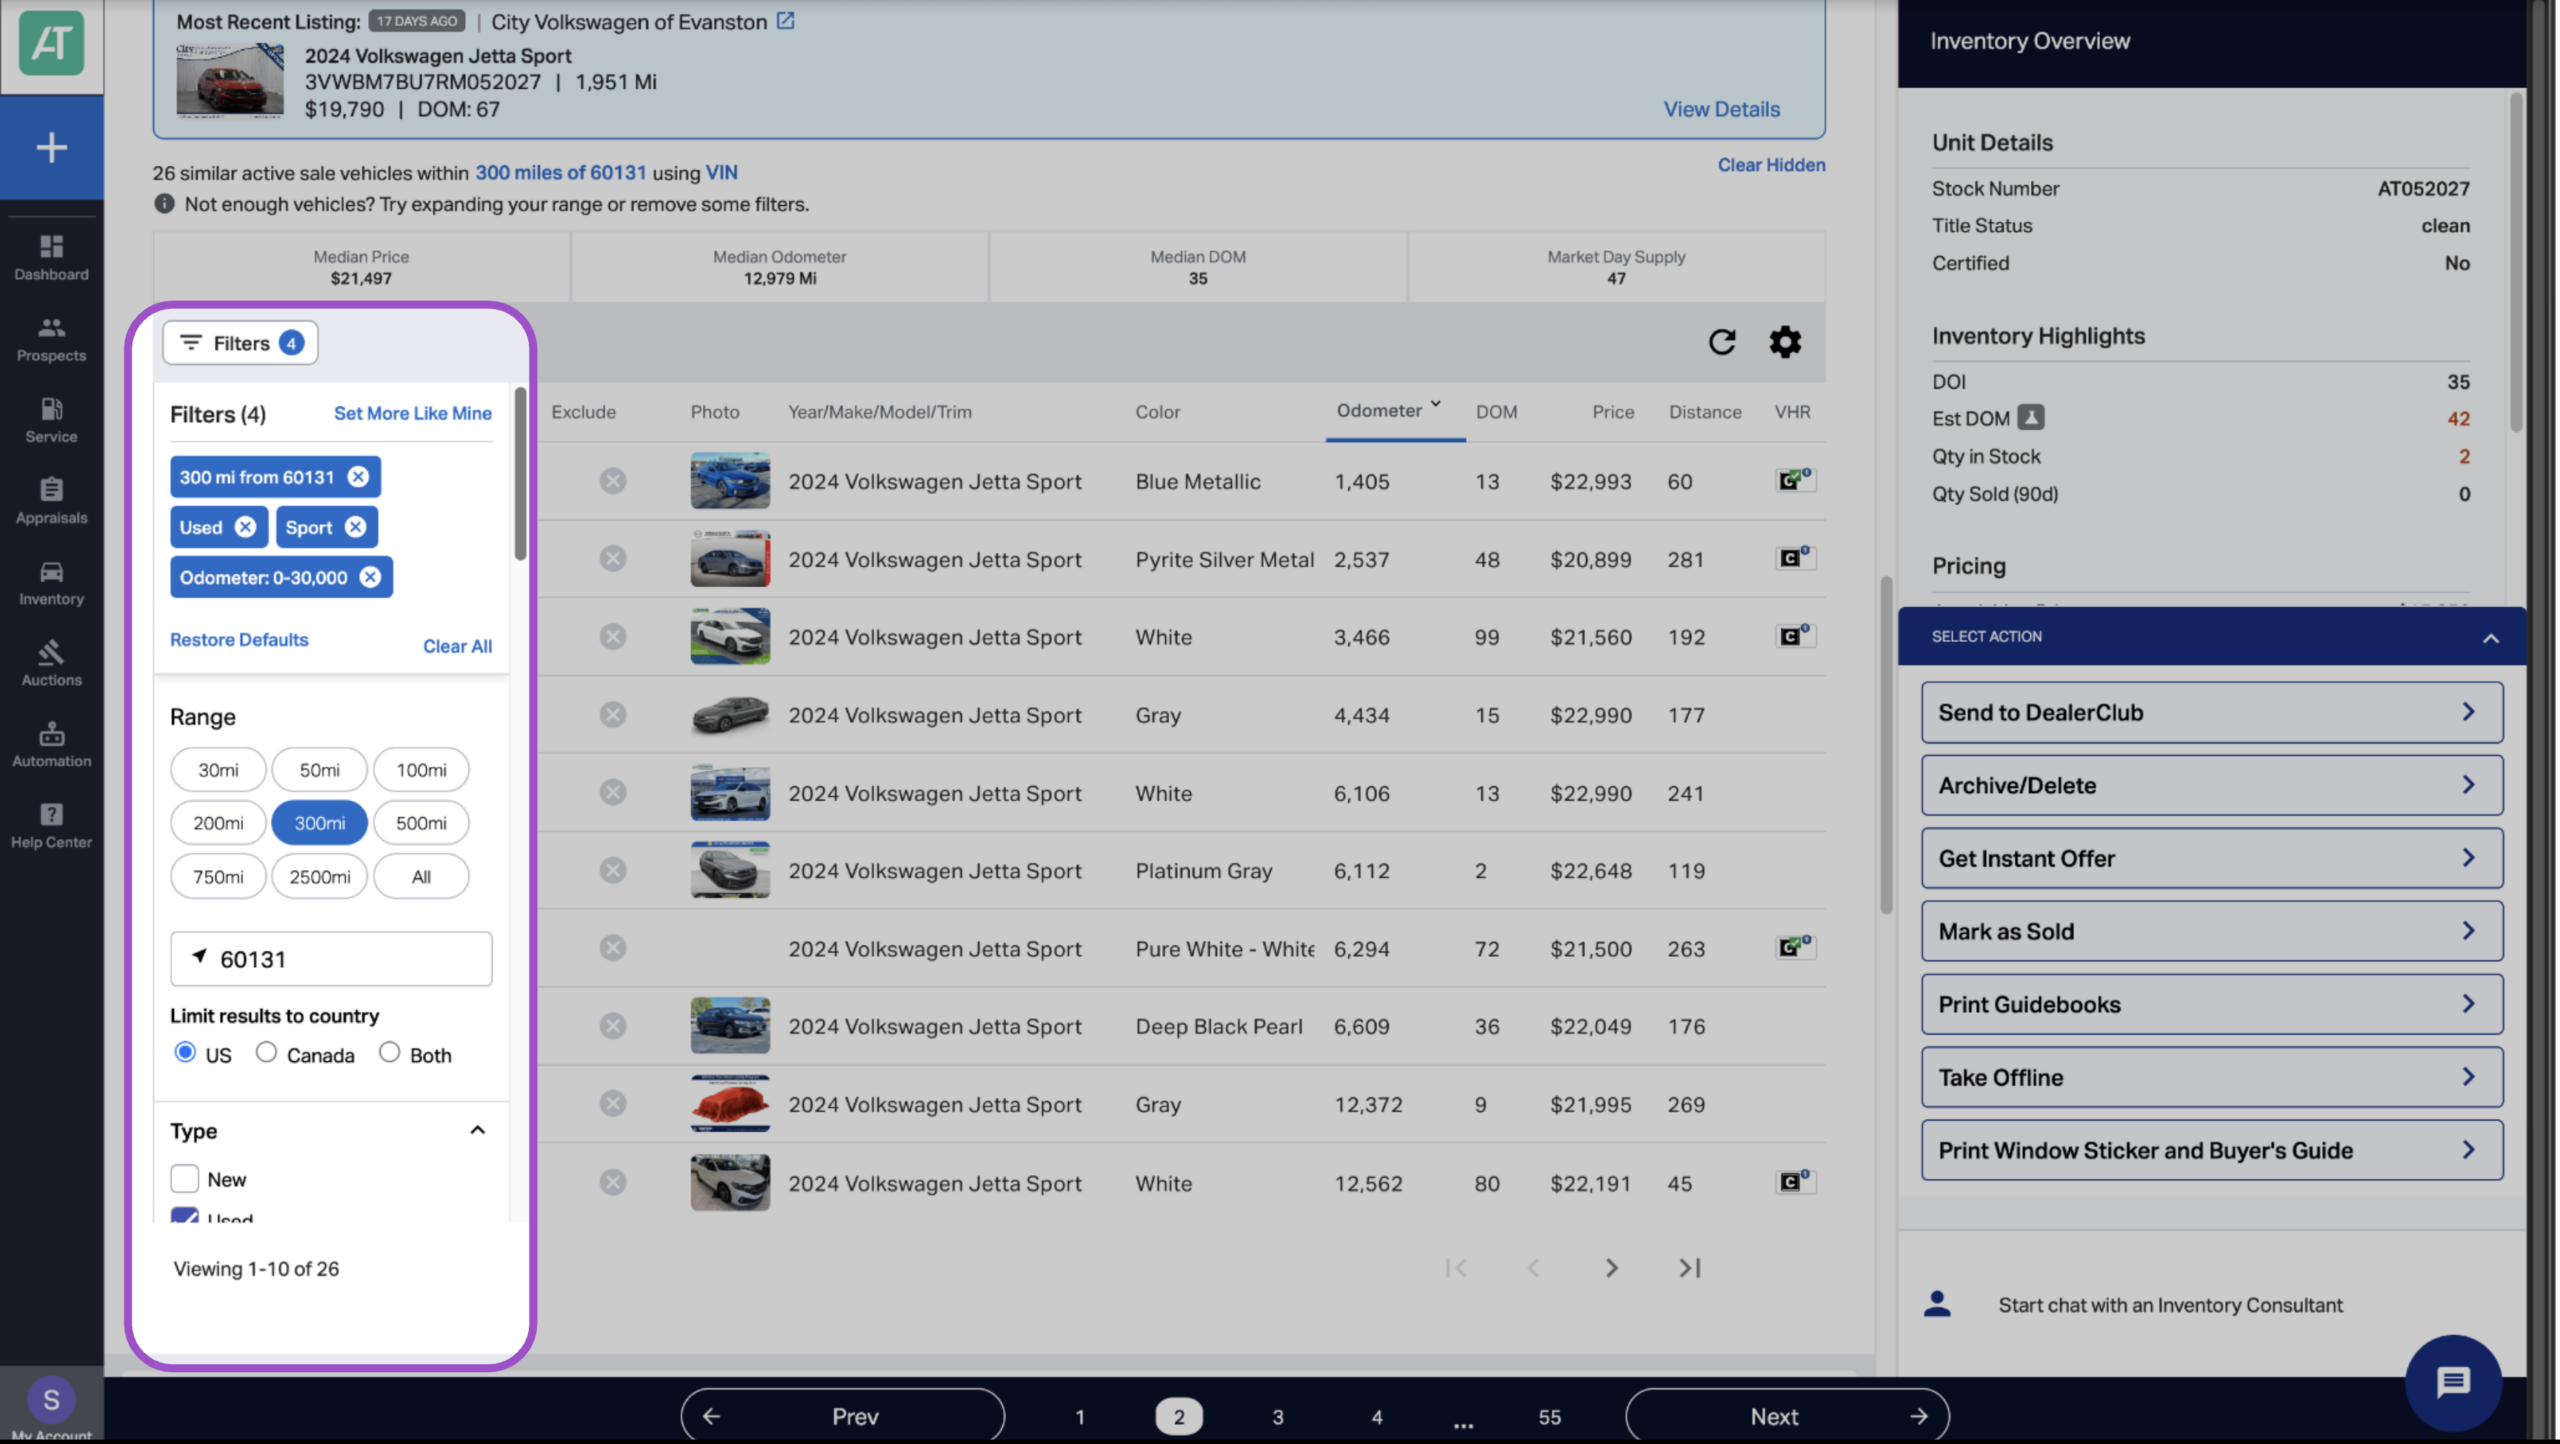
Make sure to review your updated cost-to-market ratios if you make adjustments to the competitive set.
5 Make informed exit decisions
Use Cost to Market alongside exit strategy options in the Pricing Strategy section.
Compare three paths:
- Instant Offer (guaranteed wholesale today)
- If this is higher than Total Car Cost = you’re safe
- If this is lower than Total Car Cost = you must retail or accept loss
- Target Auction (estimated wholesale value)
- If Cost to Market is above 95% and Target Auction > Total Car Cost, wholesale may be smart
- Avoid the risk of further depreciation
- Retail Profit (projected profit at current list price)
- Factor in your Adjusted Cost to Market
- Is the projected profit worth the estimated DOM?
The option with the highest estimated profit is highlighted as the Recommended Exit.

6 Review percentages regularly
Click Inventory > Dashboard to view a snapshot of your inventory, which includes your Average Adjusted Cost to Market for each category.

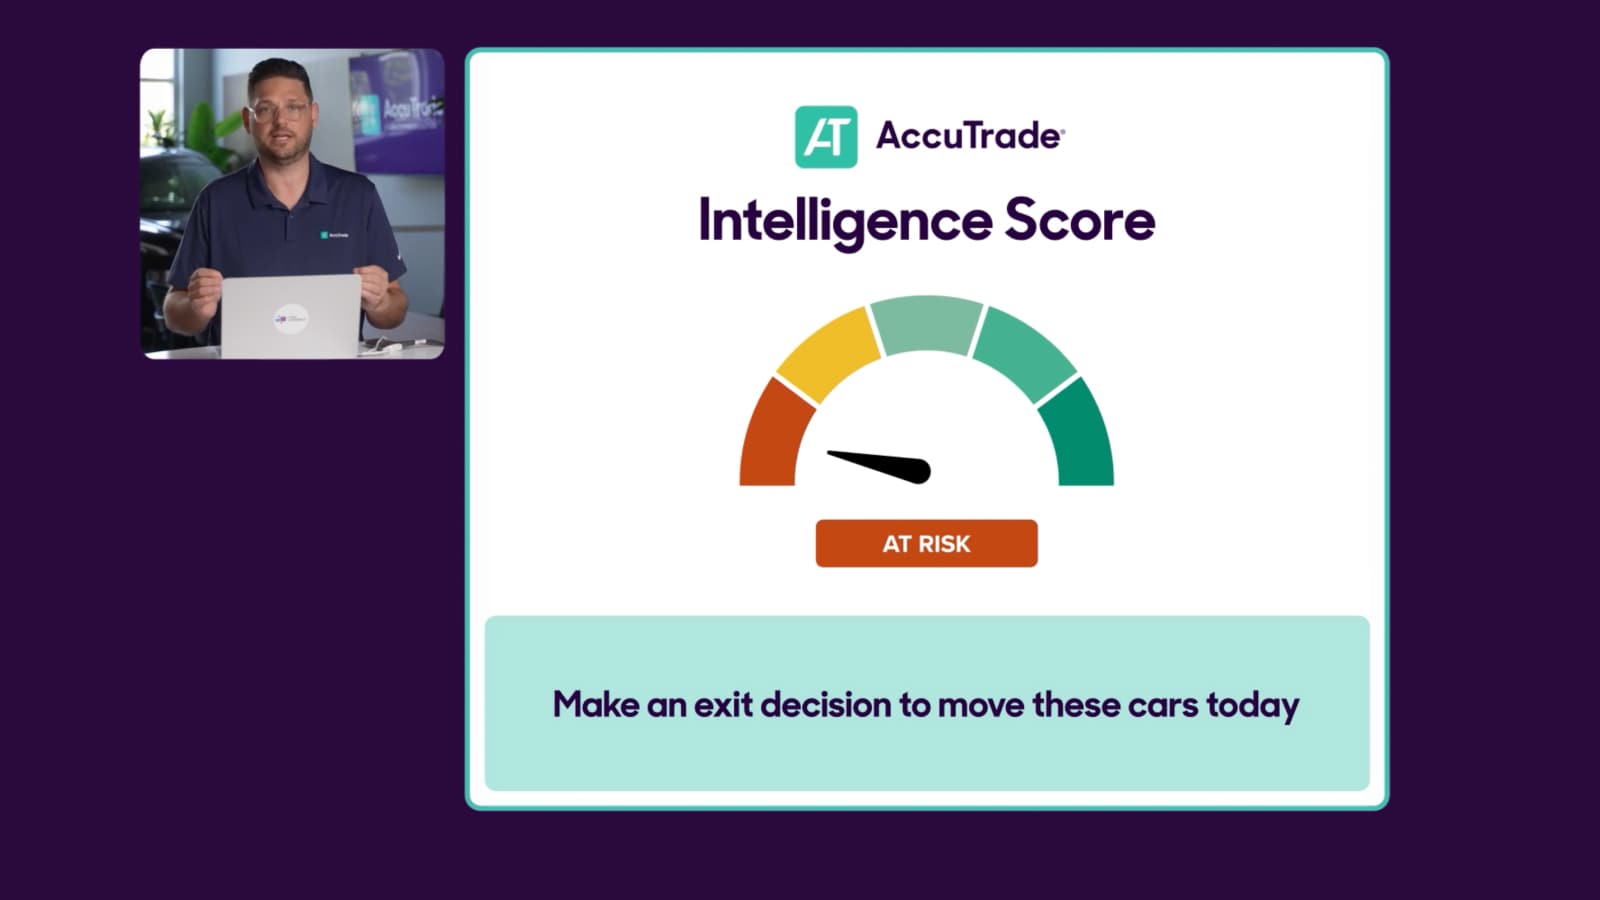
Select Intelligence Score from the drop-down menu to view by risk category. Clicking on a category in the Buckets column will take you to a list of all inventory in that category.

Check regularly (e.g., every 7 days) for any At Risk or Concerning vehicles with Adjusted Cost to Market above 90%.

Best practices for Cost to Market
Check before you buy
The best time to evaluate Cost to Market is during appraisal. If you’re about to acquire a vehicle with Cost to Market above 90%, make sure you can still exit at a profit.
Tighten competitive sets for accuracy
Generic competitive sets inflate your Cost to Market percentage. Use “Set More Like Mine” and manual exclusions for precision.
Monitor market shifts
Your Cost to Market today isn’t your Cost to Market tomorrow. Competitive set data refreshes daily. If market prices are declining, your Cost to Market percentage increases.
Example:
- Day 1: Total Car Cost $20,000 / Market Average $25,000 = 80% Cost to Market
- Day 30: Total Car Cost $20,000 / Market Average $23,000 = 87% Cost to Market
The market moved against you even though your costs didn’t change.
Use Adjusted Cost to Market for pricing decisions
Cost to Market shows acquisition strength. Adjusted Cost to Market shows actual profitability after pricing. Always reference Adjusted Cost to Market before finalizing retail list price.
Don’t rely on Cost to Market alone
Combine Cost to Market with other Market Pricing metrics, including Intelligence Score, DOM estimate, Price to Market, Wholesale Outlook, and estimated exit profits.