How to leverage Wholesale Outlook
Wholesale Outlook helps you evaluate how a vehicle’s value changes over time. By visualizing estimated profit against daily depreciation, it tells you exactly how long you have before a vehicle becomes unprofitable — or “goes underwater.”
It’s part of AccuTrade’s Market Pricing tools and is designed to help you make smarter pricing and exit decisions.
In this article, you’ll learn how to access Wholesale Outlook, interpret its key metrics, and use it to guide profitable exit decisions.
To get started
Go to the Cars.com Hub and click on AccuTrade.
1Select the vehicle from your inventory
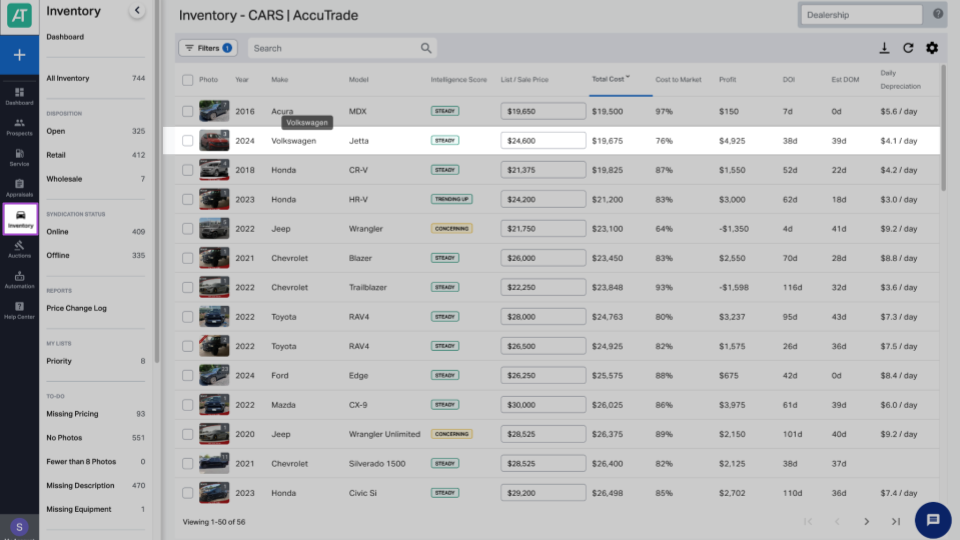
From the Inventory tab, search for and select the vehicle you want to evaluate.
2Select Market Pricing
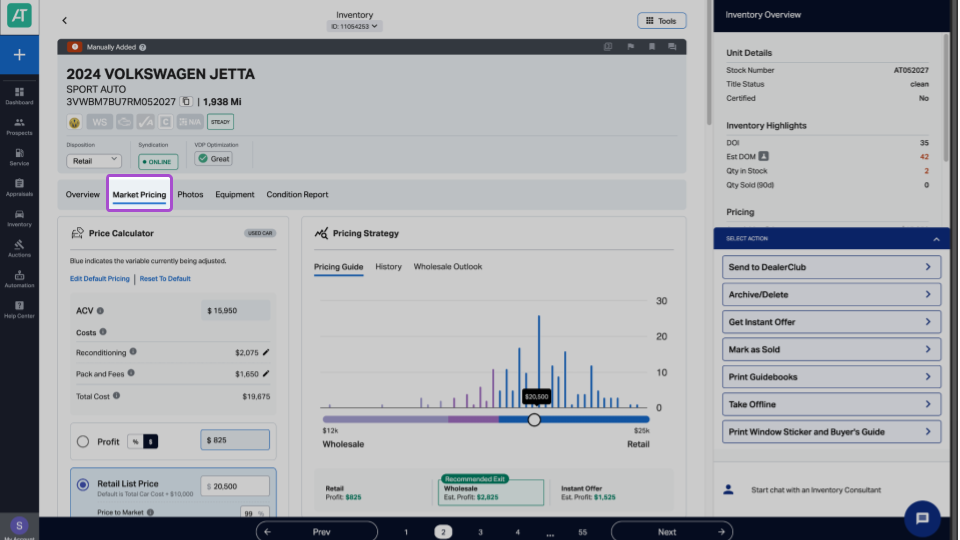
On the vehicle detail screen, click the Market Pricing tab to access valuation tools.
3Review costs and pricing
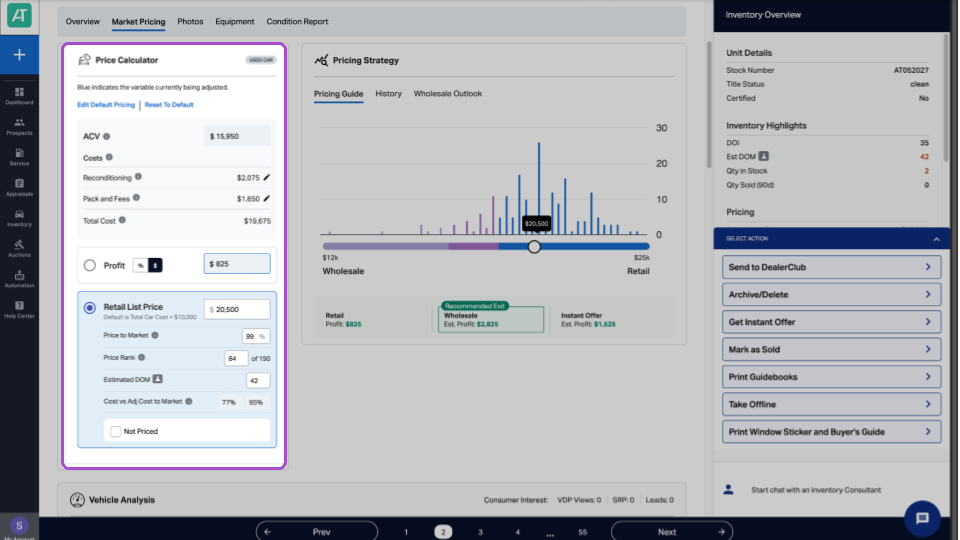
Before using Wholesale Outlook, review and update key financial inputs in the Pricing Calculator:
- ACV (Actual Cash Value)
- Reconditioning Costs
- Pack & Fees
- Retail List Price
Why this matters: Accurate cost data ensures that profit projections in Wholesale Outlook are reliable.
4View Wholesale Outlook
In the Pricing Strategy section, click the Wholesale Outlook tab.
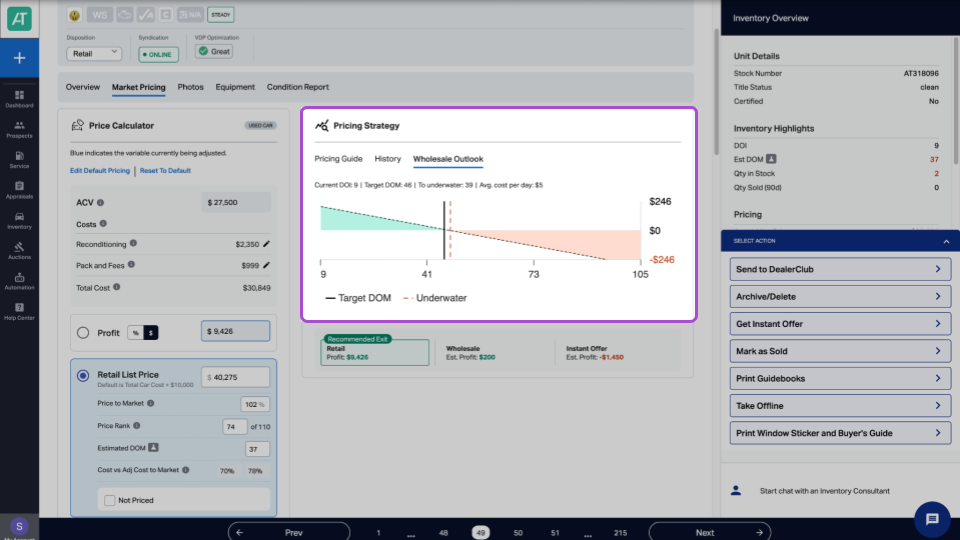
This section displays five key insights:
- Current DOI: Shows the current Days on Inventory (DOI) to help you identify aging inventory and improve turnover.
- Target DOM: Target Days on Market (DOM) is calculated from your current retail price and projected forward, helping you plan the best time to sell.
- To Underwater: Shows the number of days remaining until the vehicle goes underwater (when wholesale value drops below your total car cost), helping you understand your urgency to sell.
- Avg. cost per day: Shows your daily depreciation rate to help you understand how quickly the vehicle is losing value.
- Profitability timeline: A visual chart showing when the vehicle will become unprofitable if not sold:
- The black vertical line represents your Target DOM
- The dashed red line shows when the vehicle will go underwater
How to read the profitability timeline
The Wholesale Outlook chart gives you a clear view of your profitability window. Here’s how to read it:
- Black vertical line = Target DOM
You’re still within the expected profitable selling window. - Between black and red lines = Risk window
You’ve passed your target DOM, but the vehicle is still above water. Consider adjusting price or exit strategy. - Red dashed line = Underwater threshold
Once the vehicle passes this point, it’s projected to sell at a loss. Urgent action is needed.
5Evaluate your exit options
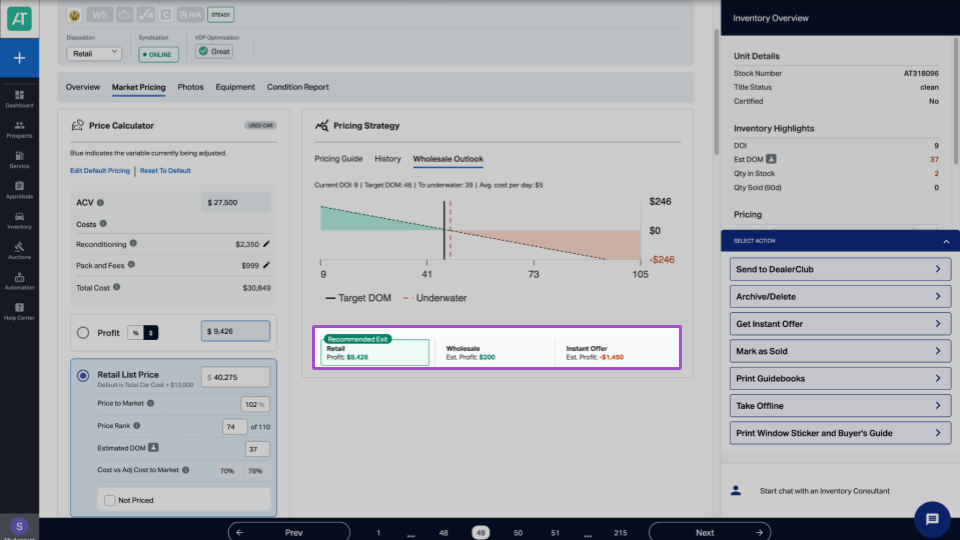
Below the timeline, you’ll see a side-by-side breakdown of estimated profit based on three different paths:
- Retail Profit: Estimated profit if sold at your current retail price
- Wholesale Profit: Estimated profit if sold through auction
- Instant Offer Profit: Guaranteed profit if sold to AccuTrade today
The highest-value option will be highlighted as your Recommended Exit.
Example: If your average depreciation is $35/day and you’re 10 days from going underwater, that’s $350 in potential loss if the vehicle doesn’t sell in time. Wholesale Outlook helps you act before that happens.
By using Wholesale Outlook consistently, you’ll gain better visibility into your inventory’s timeline, avoid avoidable losses, and make informed, profit-first decisions.