How to leverage Days on Market
Days on Market (DOM) is a forward-looking metric that forecasts how long a vehicle will take to sell in current market conditions. Unlike Market Days Supply (MDS), which measures past performance and inventory turnover rates, DOM acts as a leading indicator — helping you anticipate depreciation, pricing adjustments, and time to sale before profits erode.
In this article, you’ll learn where to find DOM in AccuTrade, how to interpret Estimated vs. Local DOM, and how to use it to make smarter acquisition and pricing decisions.
What is Days on Market?
AccuTrade provides two DOM metrics:
- Estimated DOM: Predicted days on market for the specific vehicle you’re evaluating
- Local DOM: Median days on market for similar vehicles in your competitive set
Together, these numbers help you assess vehicle-level risk and market demand before acquiring or pricing a unit.
To get started
Go to the Cars.com Hub, and click on AccuTrade.
1 Select a vehicle from your inventory
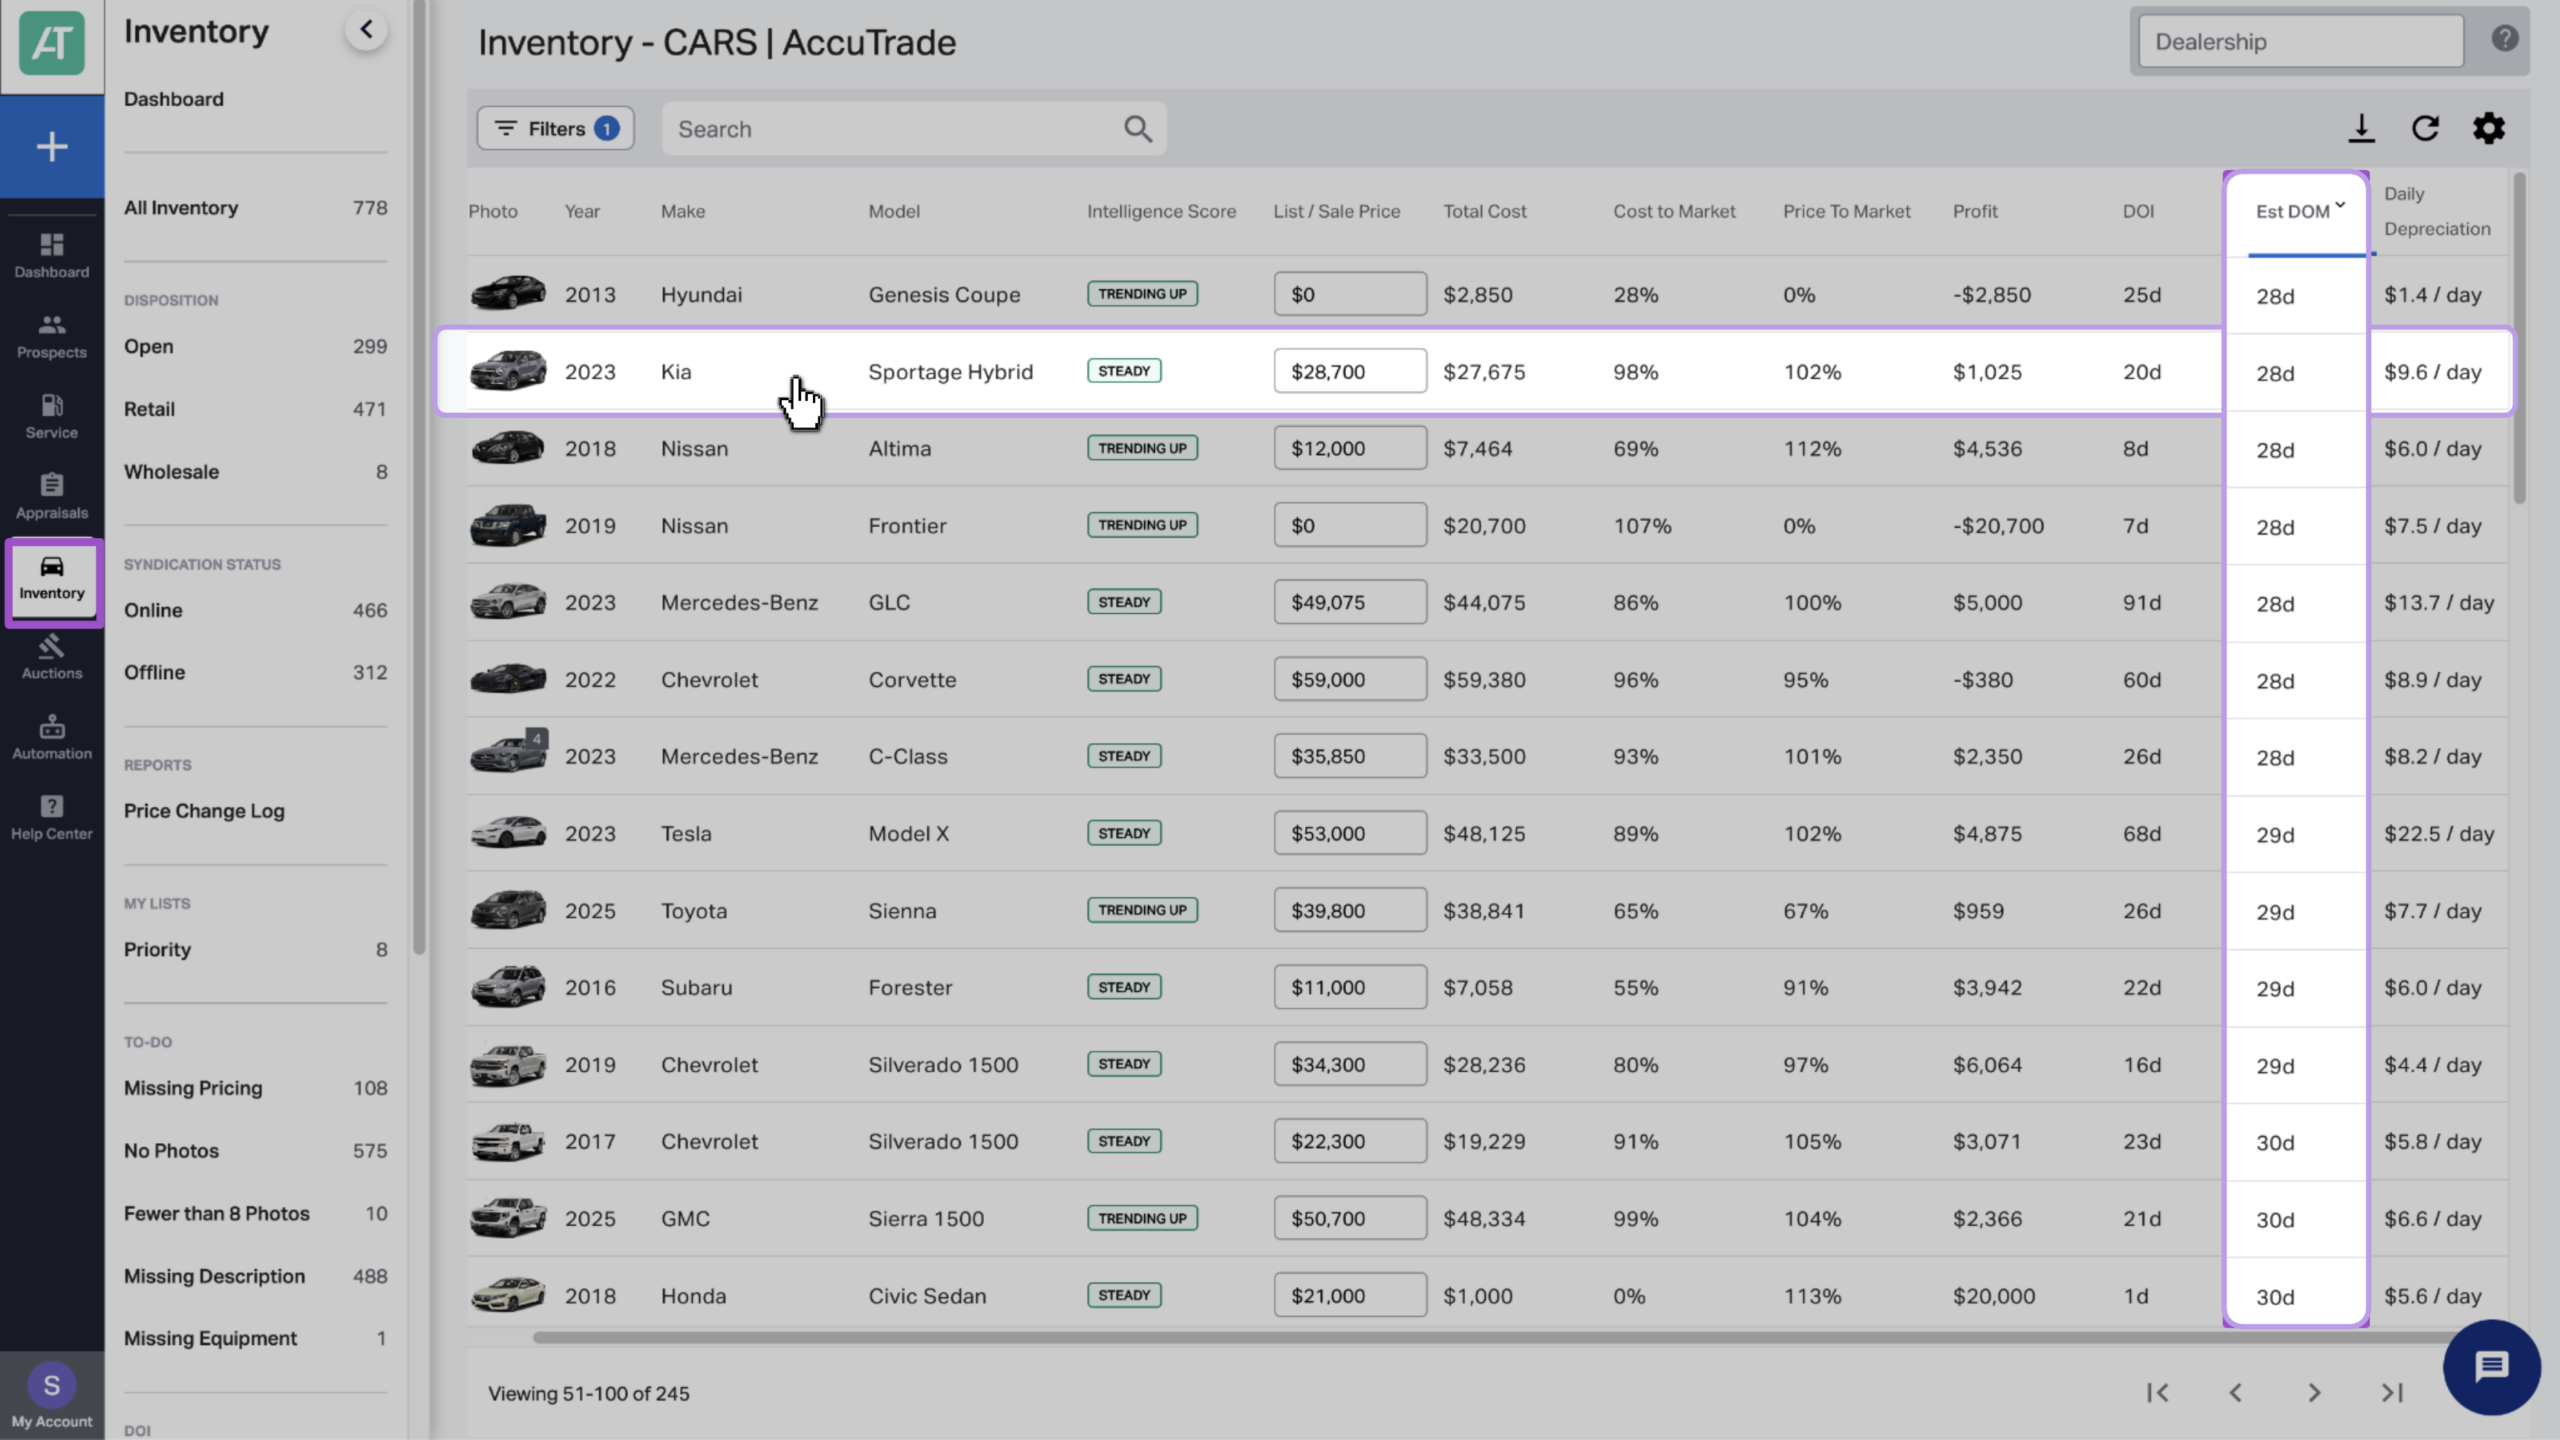
- Go to the Inventory tab.
- The Est DOM column shows the estimated Days on Market for each vehicle in your list.
- Search for and select a vehicle to view more details.
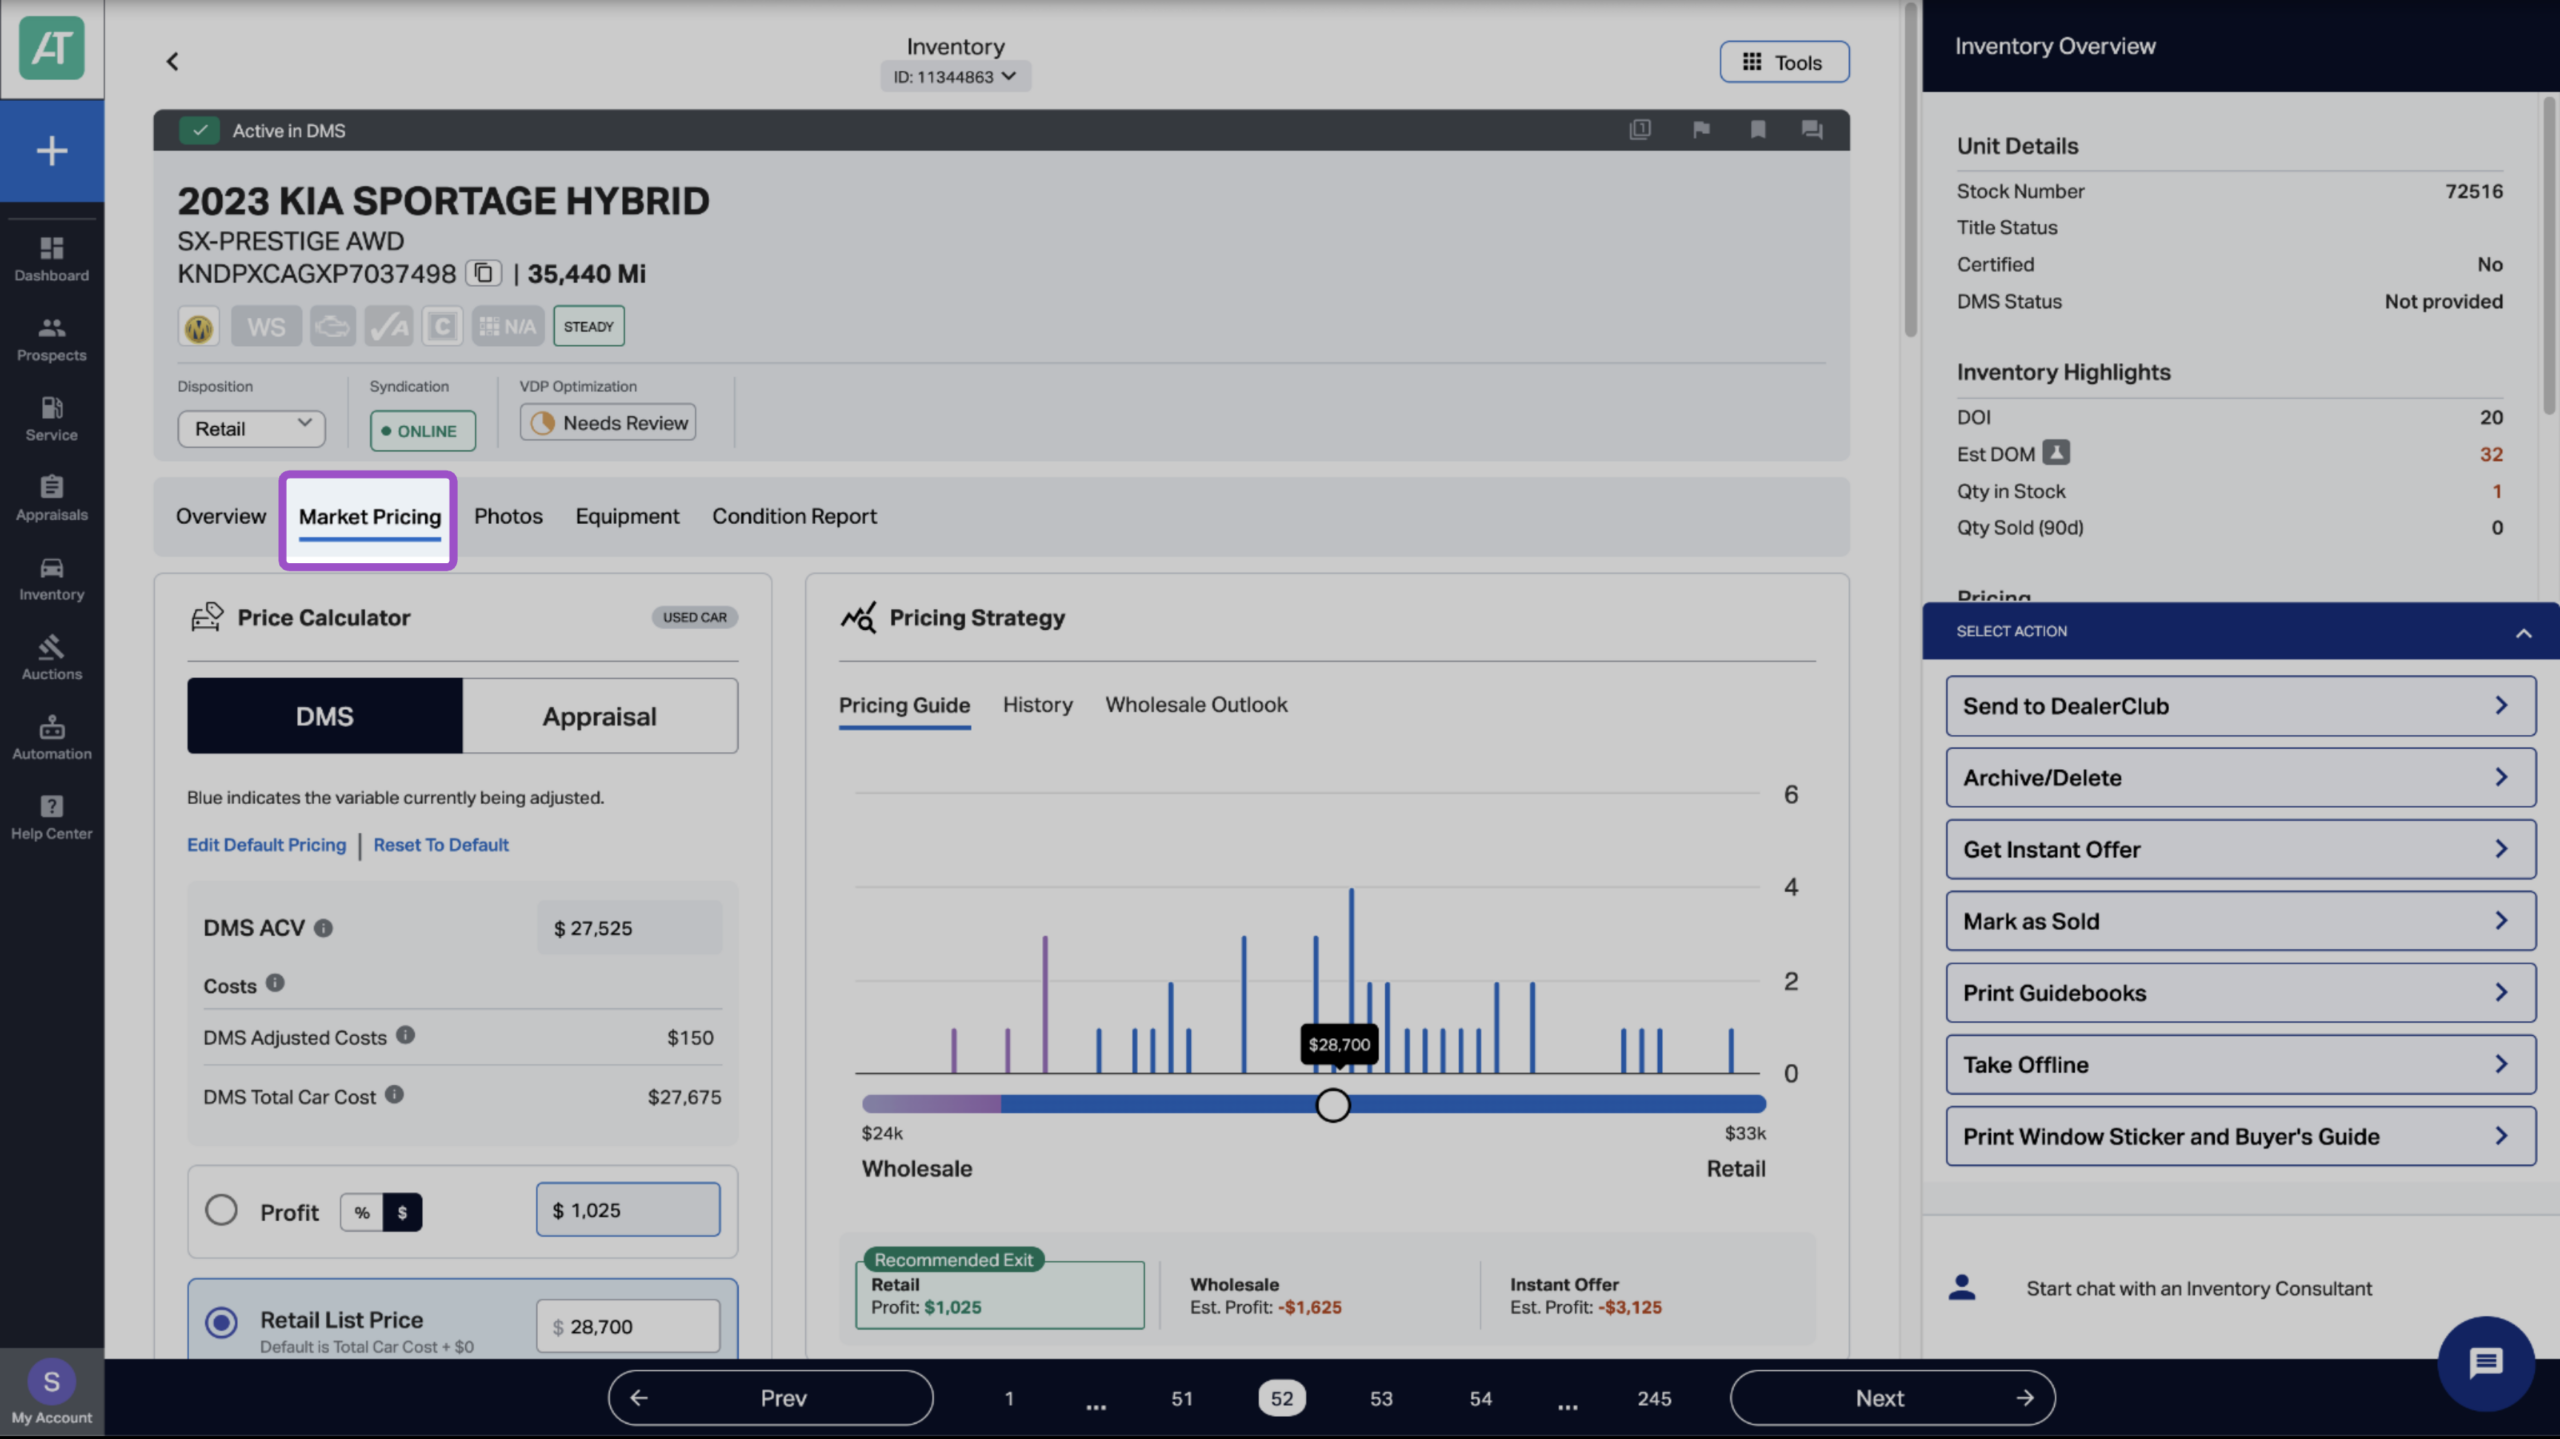
2 Select Market Pricing
From the selected vehicle’s profile, click the Market Pricing tab to explore more detailed insights.
3 Review Estimated DOM
Estimated DOM is calculated using real-time sales data from the past 30 days for the specific vehicle type in your market.
- Estimated DOM (Est DOM) is listed in the Inventory Highlights alongside DOI, Quantity in Stock, and Quantity Sold.
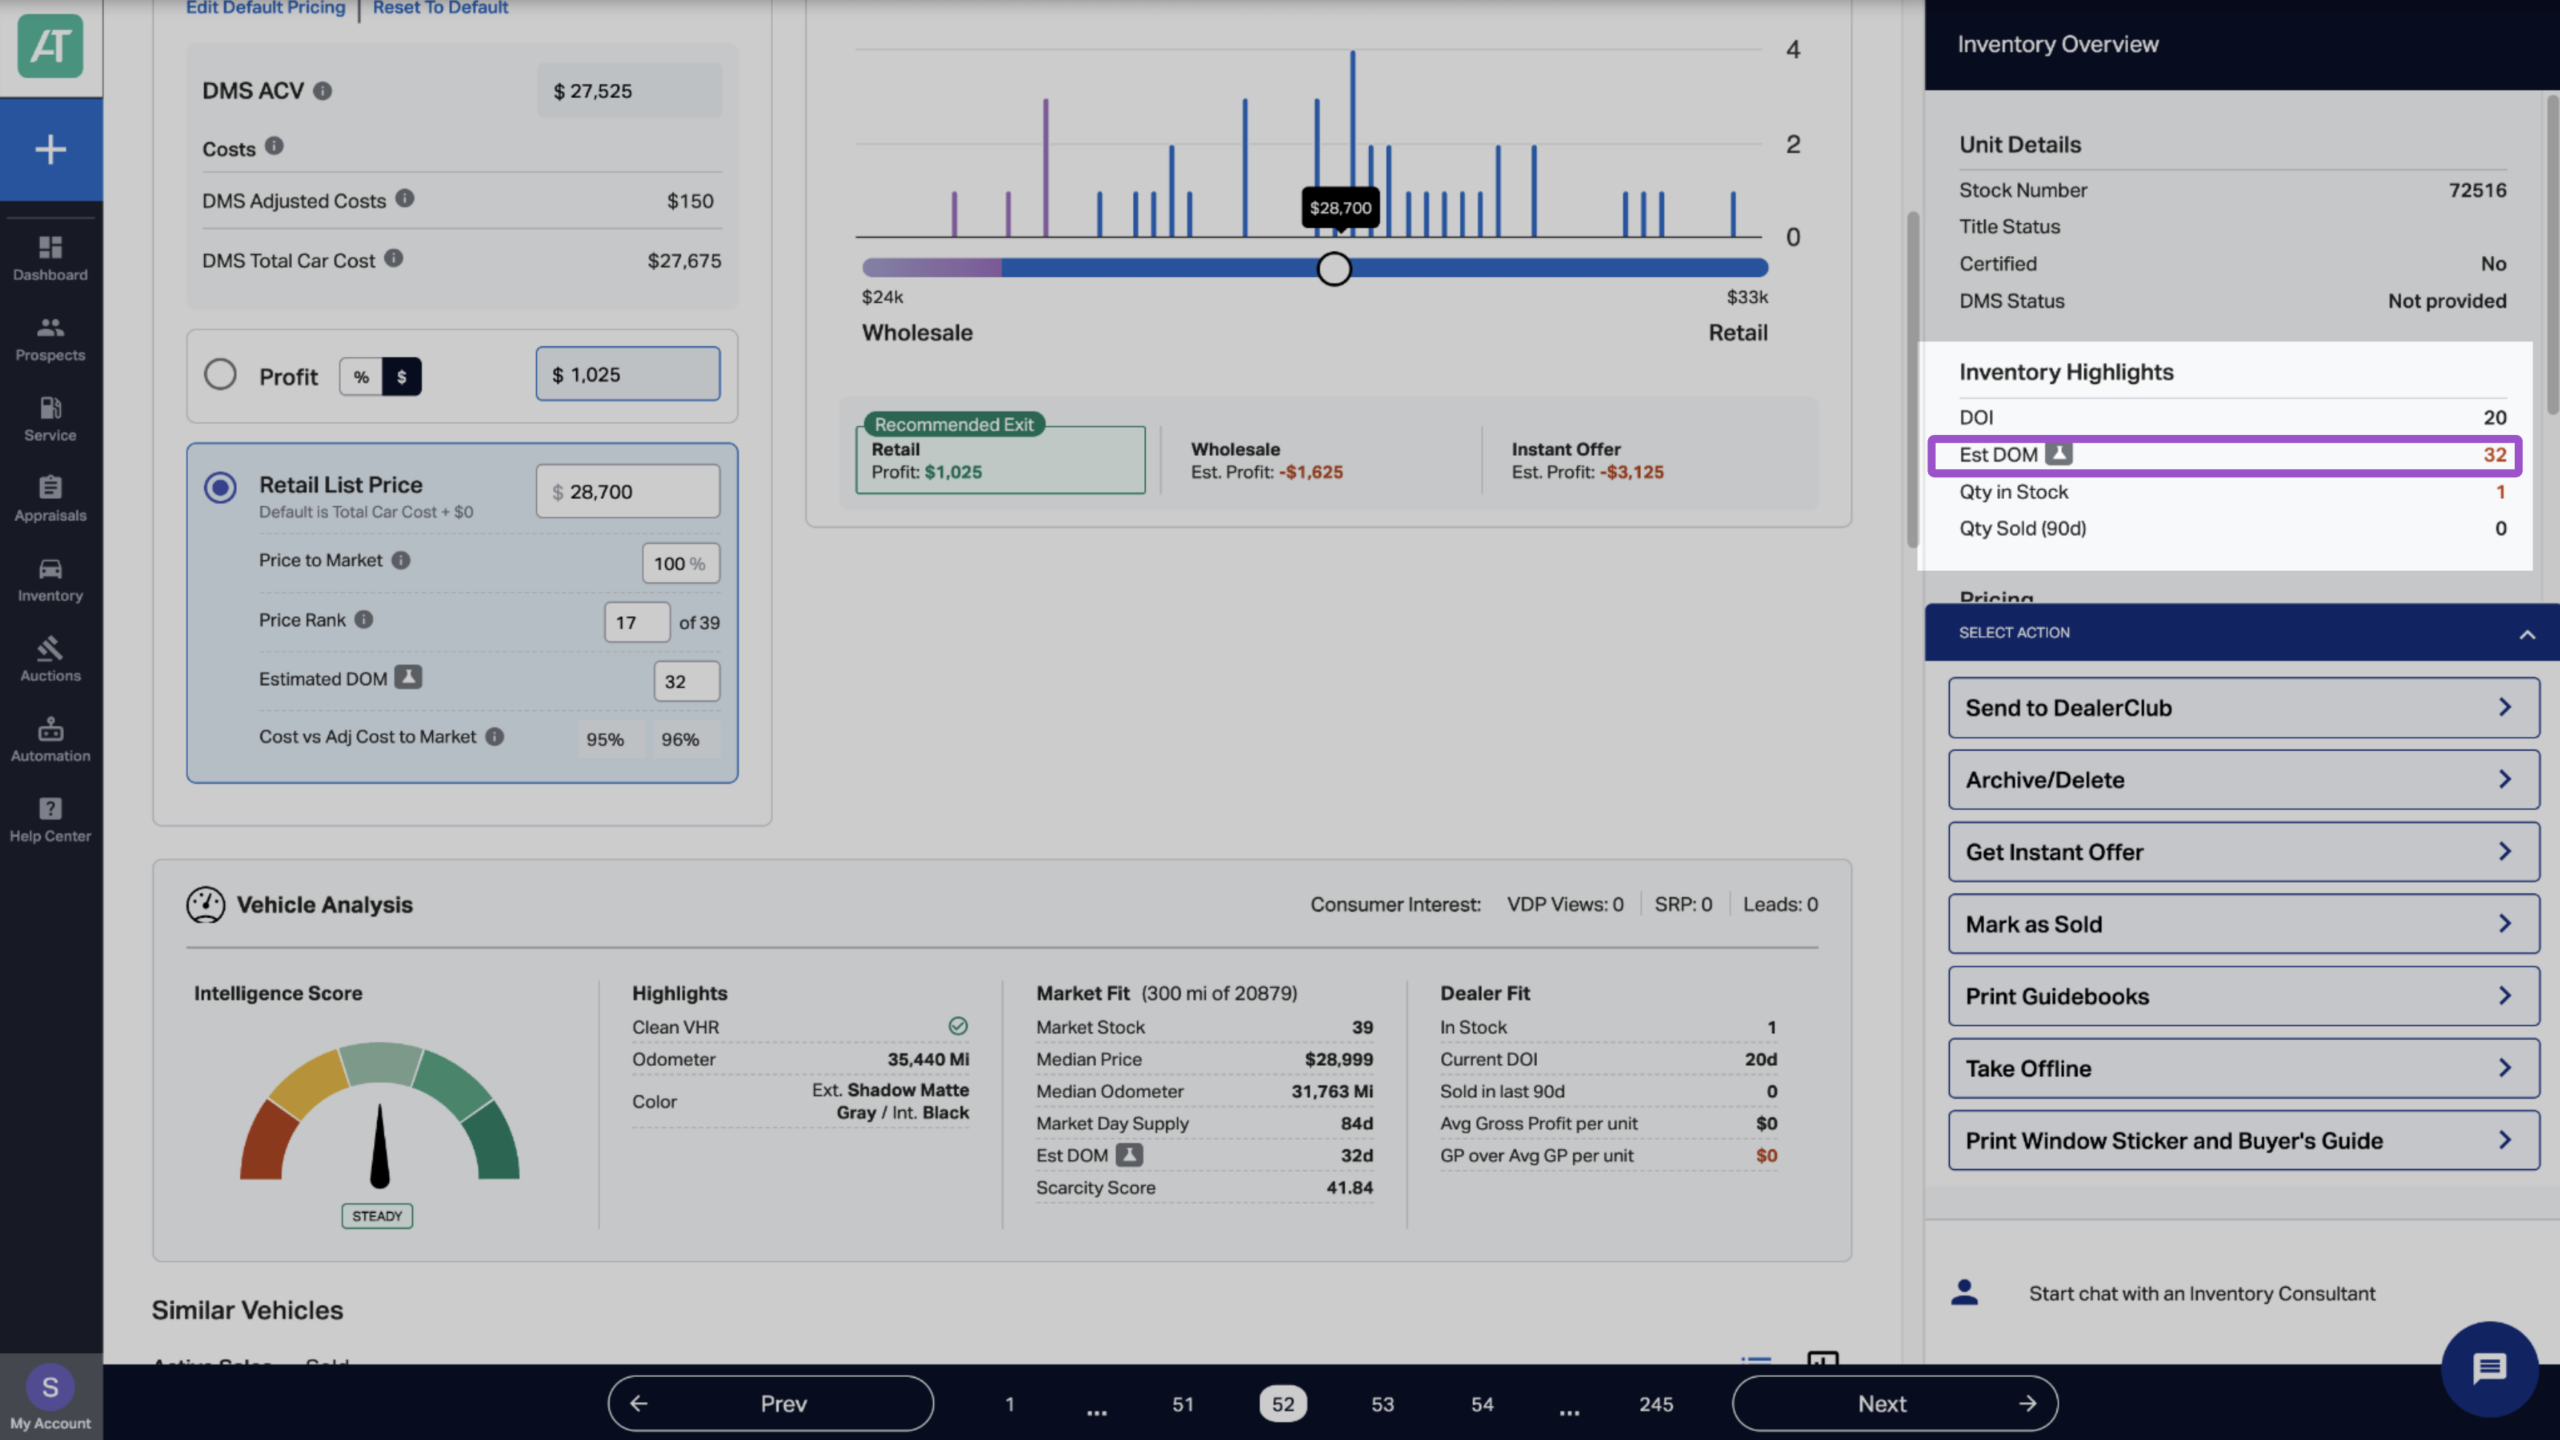
Note: When sales data is limited, estimates may show unexpected patterns. For example, lower-priced vehicles with damage history may show longer DOM, while cleaner, higher-value examples of the same model sell faster.
4 Review Local DOM
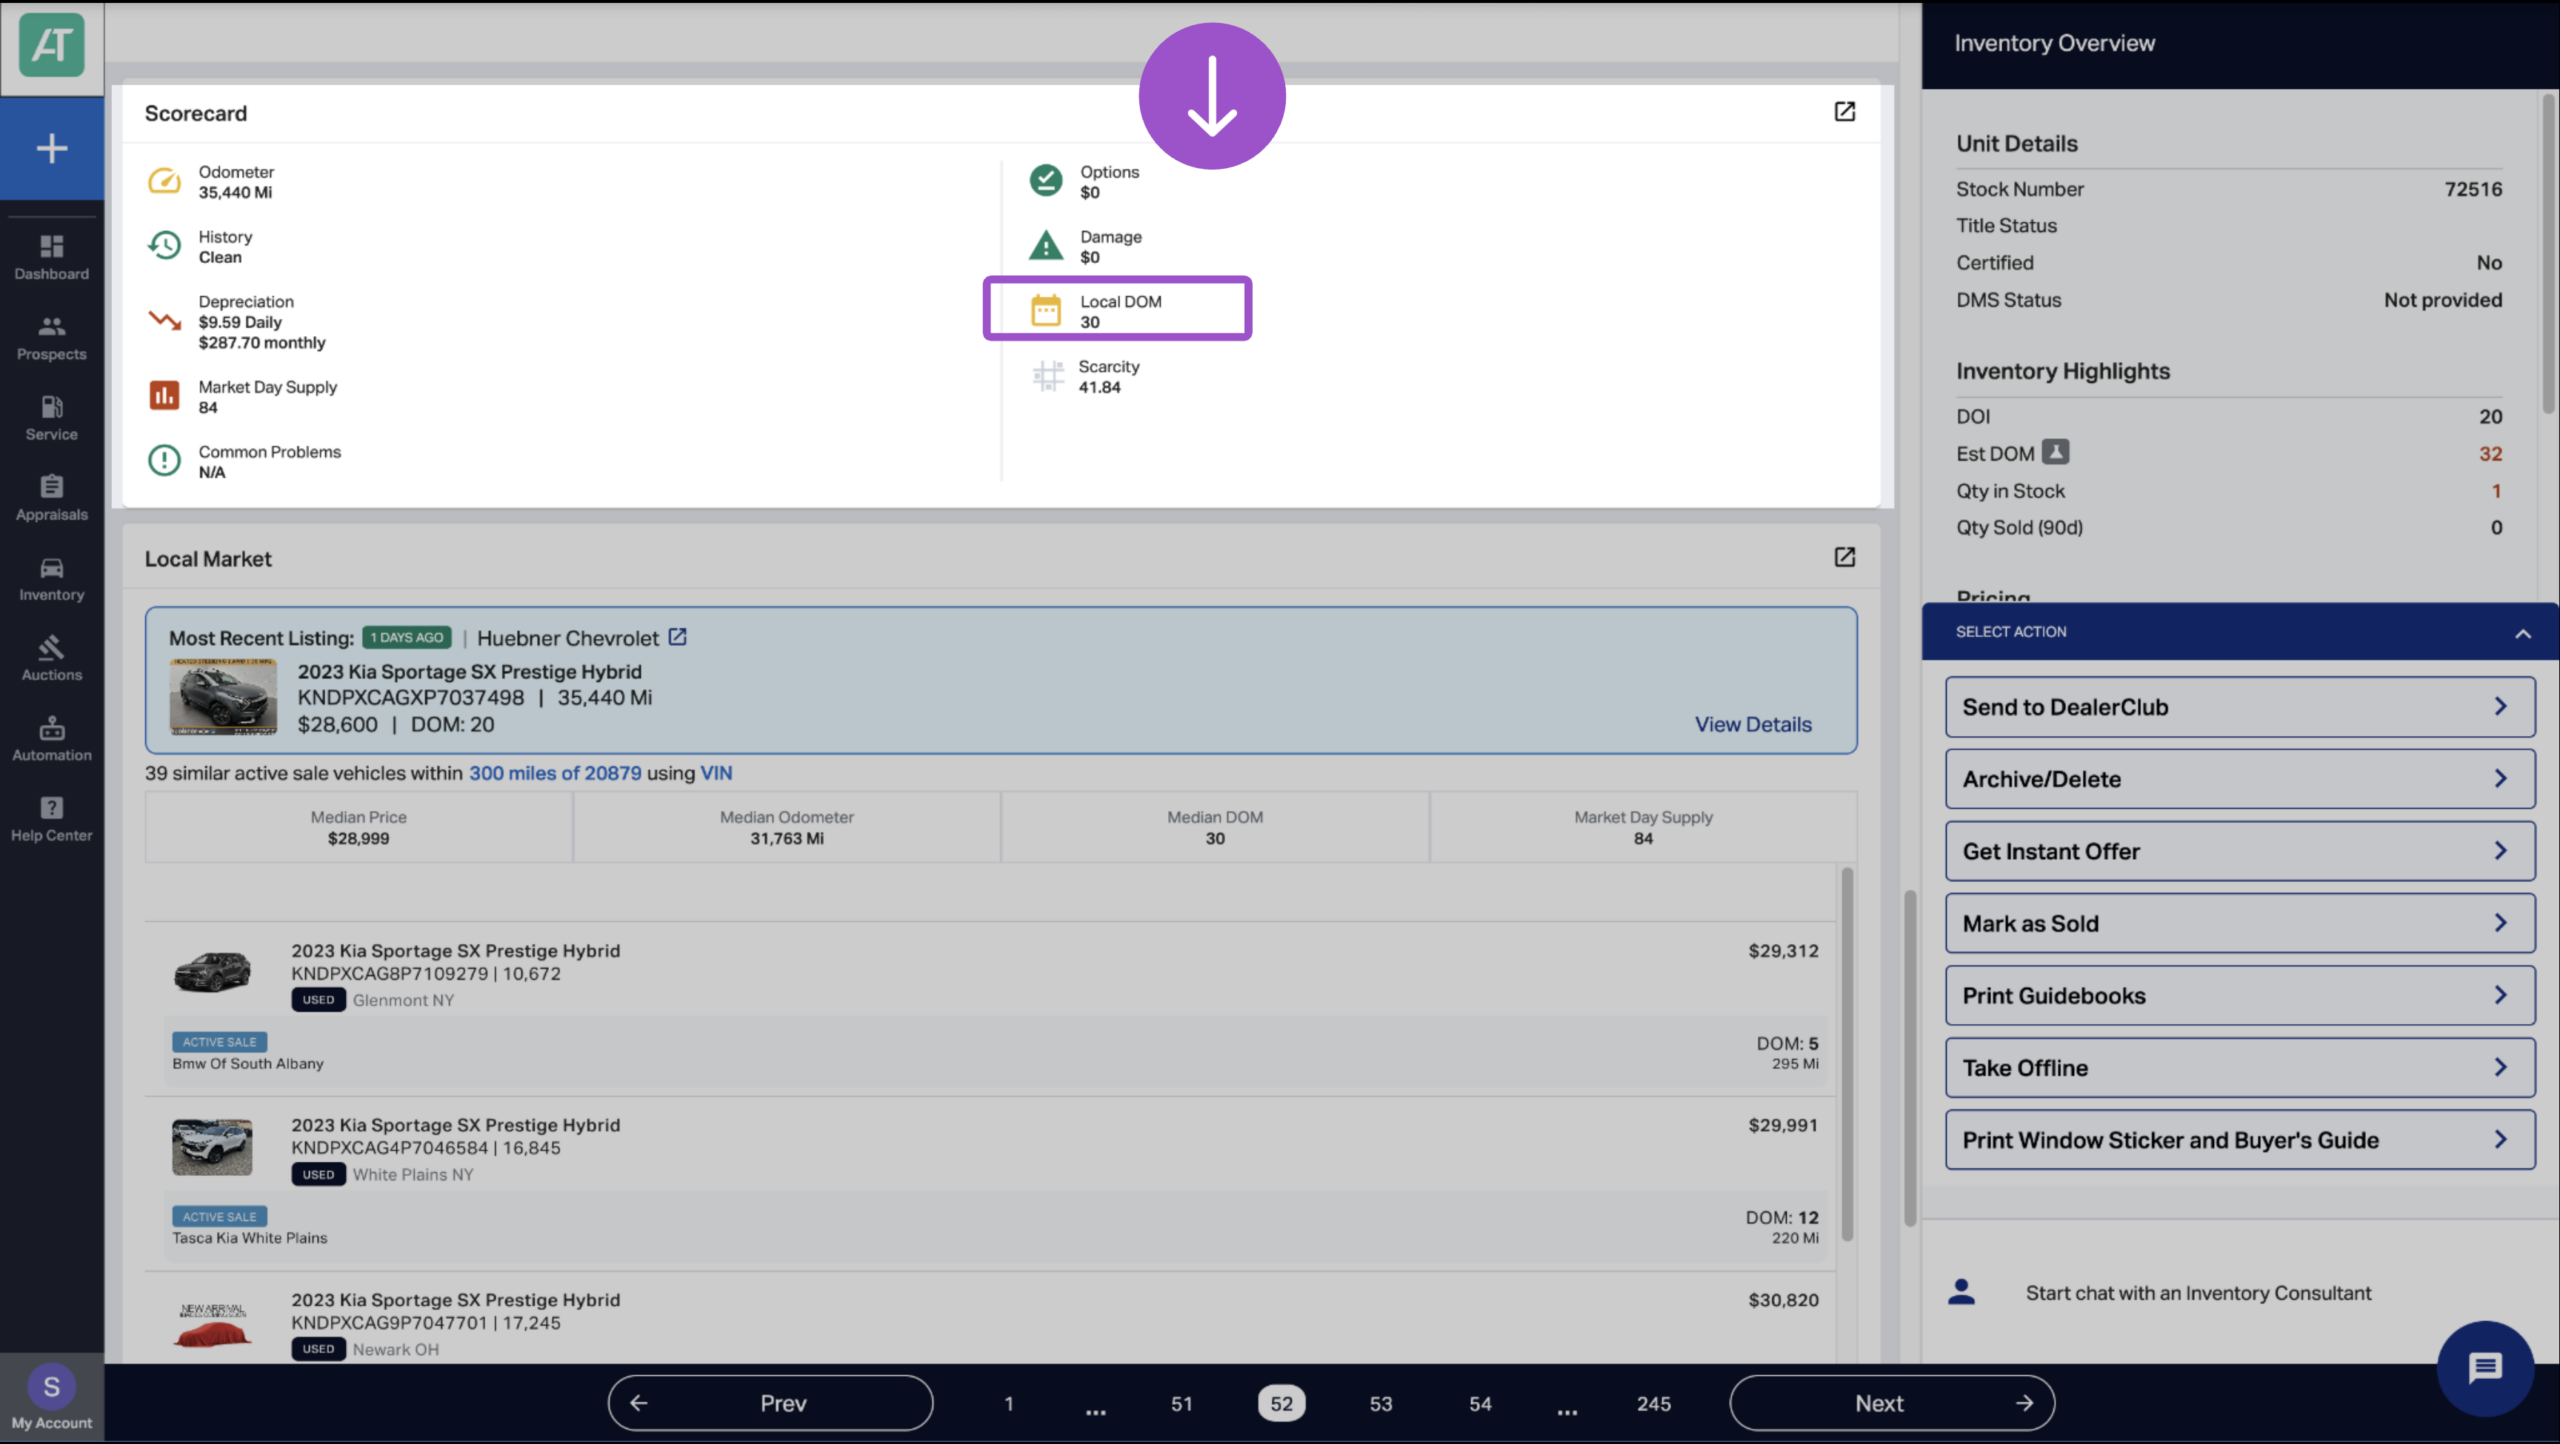
While Estimated DOM predicts performance for your specific vehicle, Local DOM shows you the broader market velocity for similar vehicles. Comparing these two numbers helps you understand if your vehicle is priced competitively within its competitive set.
- The vehicle’s Local DOM is listed on the Scorecard along with other metrics that factor into the vehicle’s Market Score: Depreciation, Market Day Supply, and Scarcity.
- The Local DOM indicator is color-coded so you can understand how quickly similar vehicles are selling in your local market:
- Green: Favorable market conditions (vehicles selling quickly)
- Yellow: Moderate market conditions (average selling time)
- Red: Challenging market conditions (vehicles taking longer to sell)
- Green: Favorable market conditions (vehicles selling quickly)
5 Making decisions with DOM
AccuTrade’s DOM metric helps you understand market conditions before you acquire a vehicle. By analyzing DOM alongside other Scorecard metrics, you can:
- Identify which vehicles will turn quickly and which will age on your lot
- Calculate realistic holding costs (multiply DOM by daily depreciation)
- Make data-driven decisions about acquisition prices
- Choose the right exit strategy (retail vs. wholesale) before you buy
The goal is simple: use DOM to see around corners and avoid acquiring vehicles that will tie up capital and erode margins while sitting on your lot.
Best practices for using DOM
Consider DOM with Vehicle Score
A vehicle in excellent condition (green Odometer, Options, VHR, Damage, & Common Problems on the Scorecard) but high DOM might still be a risky acquisition due to market conditions.
Use DOM for exit strategy planning
A high DOM suggests you may want to consider:
- Wholesale options
- AccuTrade liquidation
- More aggressive retail pricing
- Enhanced marketing efforts
Factor DOM into your offers
When DOM is high, reduce your acquisition cost accordingly to protect margins during the extended holding period.
Monitor DOM trends
Track how DOM changes over time in your market to identify seasonal patterns or shifting demand.
Combine with Scarcity Score
A low scarcity score on the Scorecard combined with a high DOM signals a saturated market where you should be cautious.